Blackfeet vs Immigrants from the Azores No Vehicles in Household
COMPARE
Blackfeet
Immigrants from the Azores
No Vehicles in Household
No Vehicles in Household Comparison
Blackfeet
Immigrants from the Azores
9.6%
NO VEHICLES IN HOUSEHOLD
91.4/ 100
METRIC RATING
123rd/ 347
METRIC RANK
9.7%
NO VEHICLES IN HOUSEHOLD
88.2/ 100
METRIC RATING
131st/ 347
METRIC RANK
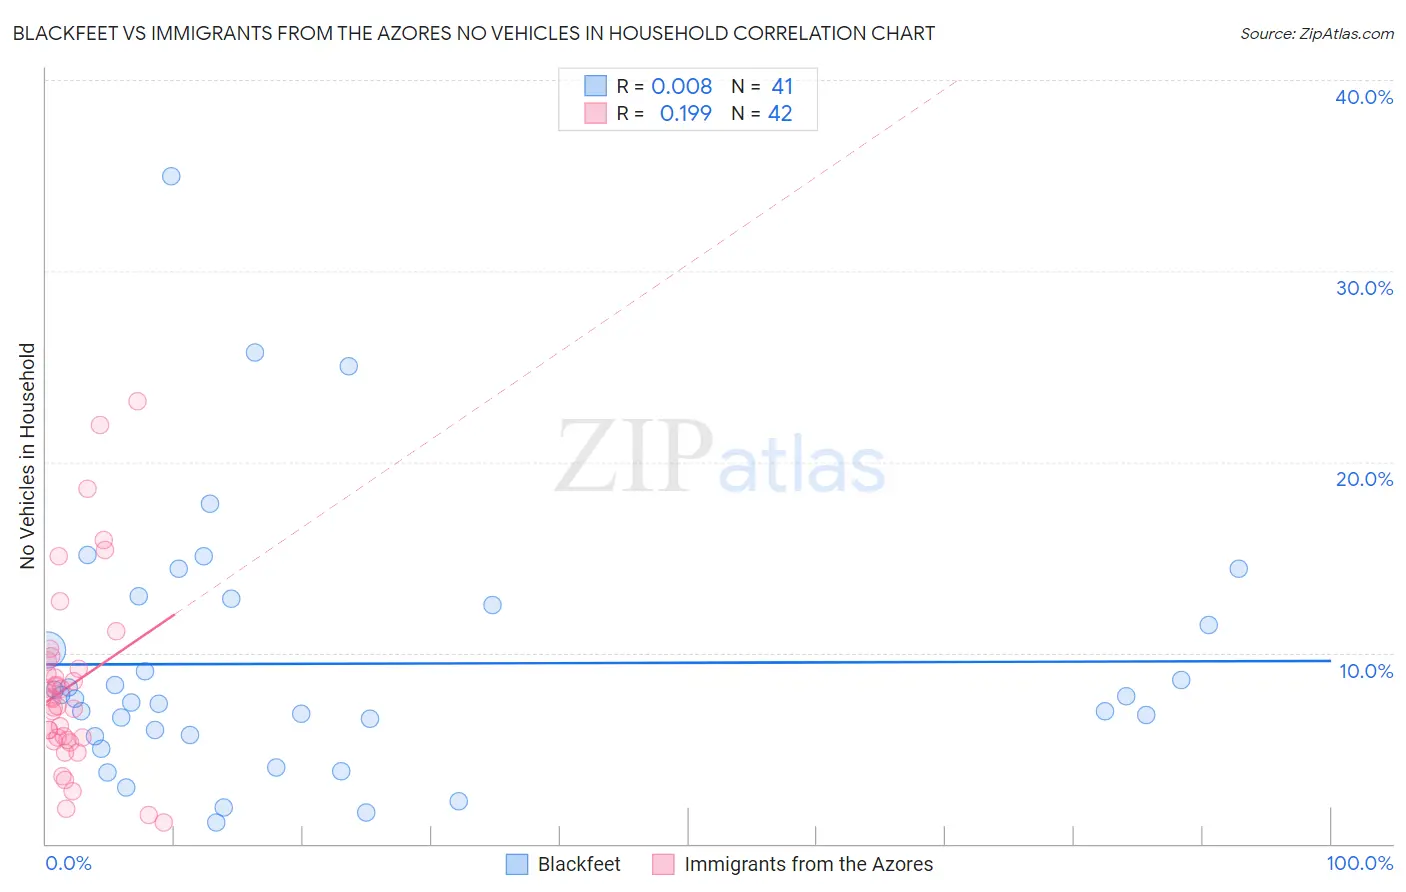
Blackfeet vs Immigrants from the Azores No Vehicles in Household Correlation Chart
The statistical analysis conducted on geographies consisting of 309,020,066 people shows no correlation between the proportion of Blackfeet and percentage of households with no vehicle available in the United States with a correlation coefficient (R) of 0.008 and weighted average of 9.6%. Similarly, the statistical analysis conducted on geographies consisting of 46,204,339 people shows a poor positive correlation between the proportion of Immigrants from the Azores and percentage of households with no vehicle available in the United States with a correlation coefficient (R) of 0.199 and weighted average of 9.7%, a difference of 1.3%.
No Vehicles in Household Correlation Summary
| Measurement | Blackfeet | Immigrants from the Azores |
| Minimum | 1.1% | 1.1% |
| Maximum | 34.9% | 23.2% |
| Range | 33.8% | 22.1% |
| Mean | 9.4% | 8.3% |
| Median | 7.6% | 7.4% |
| Interquartile 25% (IQ1) | 5.7% | 5.4% |
| Interquartile 75% (IQ3) | 12.7% | 9.6% |
| Interquartile Range (IQR) | 7.0% | 4.2% |
| Standard Deviation (Sample) | 6.9% | 5.0% |
| Standard Deviation (Population) | 6.8% | 4.9% |
Demographics Similar to Blackfeet and Immigrants from the Azores by No Vehicles in Household
In terms of no vehicles in household, the demographic groups most similar to Blackfeet are Immigrants from Korea (9.6%, a difference of 0.23%), Immigrants from Cameroon (9.6%, a difference of 0.36%), Costa Rican (9.5%, a difference of 0.46%), Puget Sound Salish (9.5%, a difference of 0.51%), and Icelander (9.6%, a difference of 0.52%). Similarly, the demographic groups most similar to Immigrants from the Azores are Kenyan (9.7%, a difference of 0.070%), Burmese (9.7%, a difference of 0.20%), Immigrants from Oceania (9.7%, a difference of 0.37%), Syrian (9.7%, a difference of 0.39%), and Nicaraguan (9.7%, a difference of 0.46%).
| Demographics | Rating | Rank | No Vehicles in Household |
| Chippewa | 93.8 /100 | #117 | Exceptional 9.4% |
| Greeks | 92.9 /100 | #118 | Exceptional 9.5% |
| Fijians | 92.7 /100 | #119 | Exceptional 9.5% |
| Immigrants | Thailand | 92.6 /100 | #120 | Exceptional 9.5% |
| Puget Sound Salish | 92.4 /100 | #121 | Exceptional 9.5% |
| Costa Ricans | 92.3 /100 | #122 | Exceptional 9.5% |
| Blackfeet | 91.4 /100 | #123 | Exceptional 9.6% |
| Immigrants | Korea | 90.9 /100 | #124 | Exceptional 9.6% |
| Immigrants | Cameroon | 90.6 /100 | #125 | Exceptional 9.6% |
| Icelanders | 90.2 /100 | #126 | Exceptional 9.6% |
| Immigrants | Kenya | 89.7 /100 | #127 | Excellent 9.6% |
| Immigrants | Syria | 89.5 /100 | #128 | Excellent 9.6% |
| Nicaraguans | 89.5 /100 | #129 | Excellent 9.7% |
| Burmese | 88.8 /100 | #130 | Excellent 9.7% |
| Immigrants | Azores | 88.2 /100 | #131 | Excellent 9.7% |
| Kenyans | 88.0 /100 | #132 | Excellent 9.7% |
| Immigrants | Oceania | 87.1 /100 | #133 | Excellent 9.7% |
| Syrians | 87.1 /100 | #134 | Excellent 9.7% |
| Latvians | 85.1 /100 | #135 | Excellent 9.8% |
| Immigrants | South Africa | 85.0 /100 | #136 | Excellent 9.8% |
| Immigrants | Moldova | 84.6 /100 | #137 | Excellent 9.8% |