Salvadoran vs Immigrants from the Azores Unemployment Among Ages 25 to 29 years
COMPARE
Salvadoran
Immigrants from the Azores
Unemployment Among Ages 25 to 29 years
Unemployment Among Ages 25 to 29 years Comparison
Salvadorans
Immigrants from the Azores
7.0%
UNEMPLOYMENT AMONG AGES 25 TO 29 YEARS
4.4/ 100
METRIC RATING
227th/ 347
METRIC RANK
8.1%
UNEMPLOYMENT AMONG AGES 25 TO 29 YEARS
0.0/ 100
METRIC RATING
311th/ 347
METRIC RANK
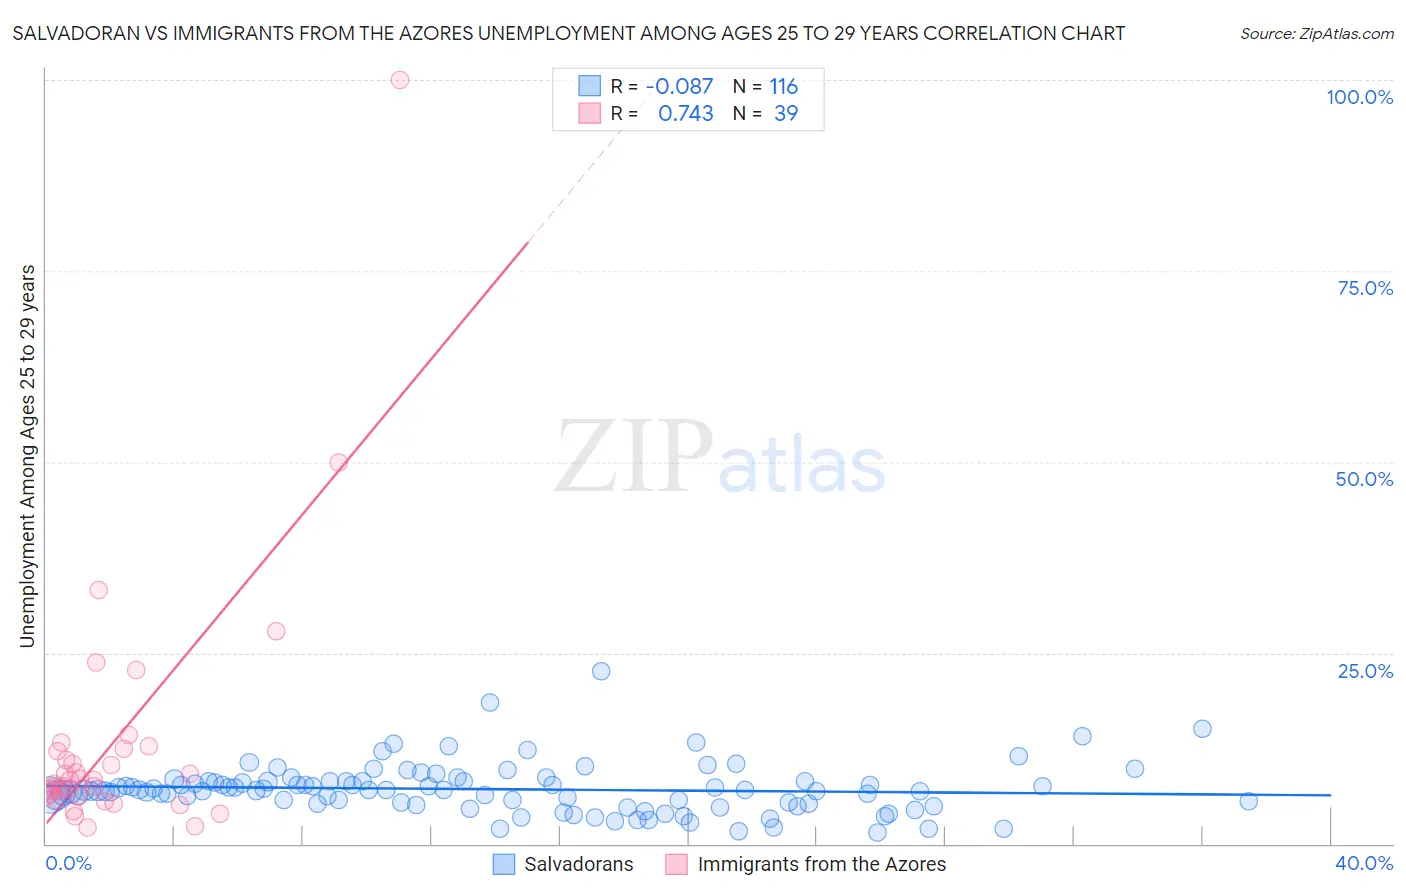
Salvadoran vs Immigrants from the Azores Unemployment Among Ages 25 to 29 years Correlation Chart
The statistical analysis conducted on geographies consisting of 382,555,814 people shows a slight negative correlation between the proportion of Salvadorans and unemployment rate among population between the ages 25 and 29 in the United States with a correlation coefficient (R) of -0.087 and weighted average of 7.0%. Similarly, the statistical analysis conducted on geographies consisting of 45,622,335 people shows a strong positive correlation between the proportion of Immigrants from the Azores and unemployment rate among population between the ages 25 and 29 in the United States with a correlation coefficient (R) of 0.743 and weighted average of 8.1%, a difference of 16.4%.
Unemployment Among Ages 25 to 29 years Correlation Summary
| Measurement | Salvadoran | Immigrants from the Azores |
| Minimum | 1.4% | 2.1% |
| Maximum | 22.6% | 100.0% |
| Range | 21.1% | 97.9% |
| Mean | 7.1% | 13.2% |
| Median | 7.0% | 8.4% |
| Interquartile 25% (IQ1) | 5.3% | 6.2% |
| Interquartile 75% (IQ3) | 8.2% | 12.5% |
| Interquartile Range (IQR) | 2.9% | 6.3% |
| Standard Deviation (Sample) | 3.2% | 17.0% |
| Standard Deviation (Population) | 3.2% | 16.8% |
Similar Demographics by Unemployment Among Ages 25 to 29 years
Demographics Similar to Salvadorans by Unemployment Among Ages 25 to 29 years
In terms of unemployment among ages 25 to 29 years, the demographic groups most similar to Salvadorans are Immigrants from Panama (7.0%, a difference of 0.050%), Immigrants from Liberia (7.0%, a difference of 0.13%), Bermudan (7.0%, a difference of 0.21%), Immigrants from El Salvador (7.0%, a difference of 0.29%), and Japanese (6.9%, a difference of 0.32%).
| Demographics | Rating | Rank | Unemployment Among Ages 25 to 29 years |
| French | 10.5 /100 | #220 | Poor 6.9% |
| Israelis | 9.8 /100 | #221 | Tragic 6.9% |
| Spaniards | 7.7 /100 | #222 | Tragic 6.9% |
| Celtics | 7.6 /100 | #223 | Tragic 6.9% |
| Immigrants | Immigrants | 6.2 /100 | #224 | Tragic 6.9% |
| Japanese | 5.4 /100 | #225 | Tragic 6.9% |
| Immigrants | Liberia | 4.8 /100 | #226 | Tragic 7.0% |
| Salvadorans | 4.4 /100 | #227 | Tragic 7.0% |
| Immigrants | Panama | 4.2 /100 | #228 | Tragic 7.0% |
| Bermudans | 3.8 /100 | #229 | Tragic 7.0% |
| Immigrants | El Salvador | 3.6 /100 | #230 | Tragic 7.0% |
| Central Americans | 3.0 /100 | #231 | Tragic 7.0% |
| Spanish Americans | 2.7 /100 | #232 | Tragic 7.0% |
| Immigrants | Honduras | 2.4 /100 | #233 | Tragic 7.0% |
| French Canadians | 2.4 /100 | #234 | Tragic 7.0% |
Demographics Similar to Immigrants from the Azores by Unemployment Among Ages 25 to 29 years
In terms of unemployment among ages 25 to 29 years, the demographic groups most similar to Immigrants from the Azores are U.S. Virgin Islander (8.1%, a difference of 0.24%), Immigrants from Haiti (8.1%, a difference of 0.25%), Immigrants from Jamaica (8.1%, a difference of 0.26%), Immigrants from Barbados (8.0%, a difference of 0.68%), and Haitian (8.0%, a difference of 0.85%).
| Demographics | Rating | Rank | Unemployment Among Ages 25 to 29 years |
| Cajuns | 0.0 /100 | #304 | Tragic 8.0% |
| Tsimshian | 0.0 /100 | #305 | Tragic 8.0% |
| Haitians | 0.0 /100 | #306 | Tragic 8.0% |
| Immigrants | Barbados | 0.0 /100 | #307 | Tragic 8.0% |
| Immigrants | Jamaica | 0.0 /100 | #308 | Tragic 8.1% |
| Immigrants | Haiti | 0.0 /100 | #309 | Tragic 8.1% |
| U.S. Virgin Islanders | 0.0 /100 | #310 | Tragic 8.1% |
| Immigrants | Azores | 0.0 /100 | #311 | Tragic 8.1% |
| Dutch West Indians | 0.0 /100 | #312 | Tragic 8.2% |
| Immigrants | St. Vincent and the Grenadines | 0.0 /100 | #313 | Tragic 8.4% |
| Immigrants | Dominica | 0.0 /100 | #314 | Tragic 8.4% |
| British West Indians | 0.0 /100 | #315 | Tragic 8.4% |
| Immigrants | Grenada | 0.0 /100 | #316 | Tragic 8.4% |
| Immigrants | Guyana | 0.0 /100 | #317 | Tragic 8.5% |
| Guyanese | 0.0 /100 | #318 | Tragic 8.5% |