Romanian vs Scotch-Irish No Vehicles in Household
COMPARE
Romanian
Scotch-Irish
No Vehicles in Household
No Vehicles in Household Comparison
Romanians
Scotch-Irish
10.9%
NO VEHICLES IN HOUSEHOLD
17.9/ 100
METRIC RATING
202nd/ 347
METRIC RANK
6.8%
NO VEHICLES IN HOUSEHOLD
100.0/ 100
METRIC RATING
9th/ 347
METRIC RANK
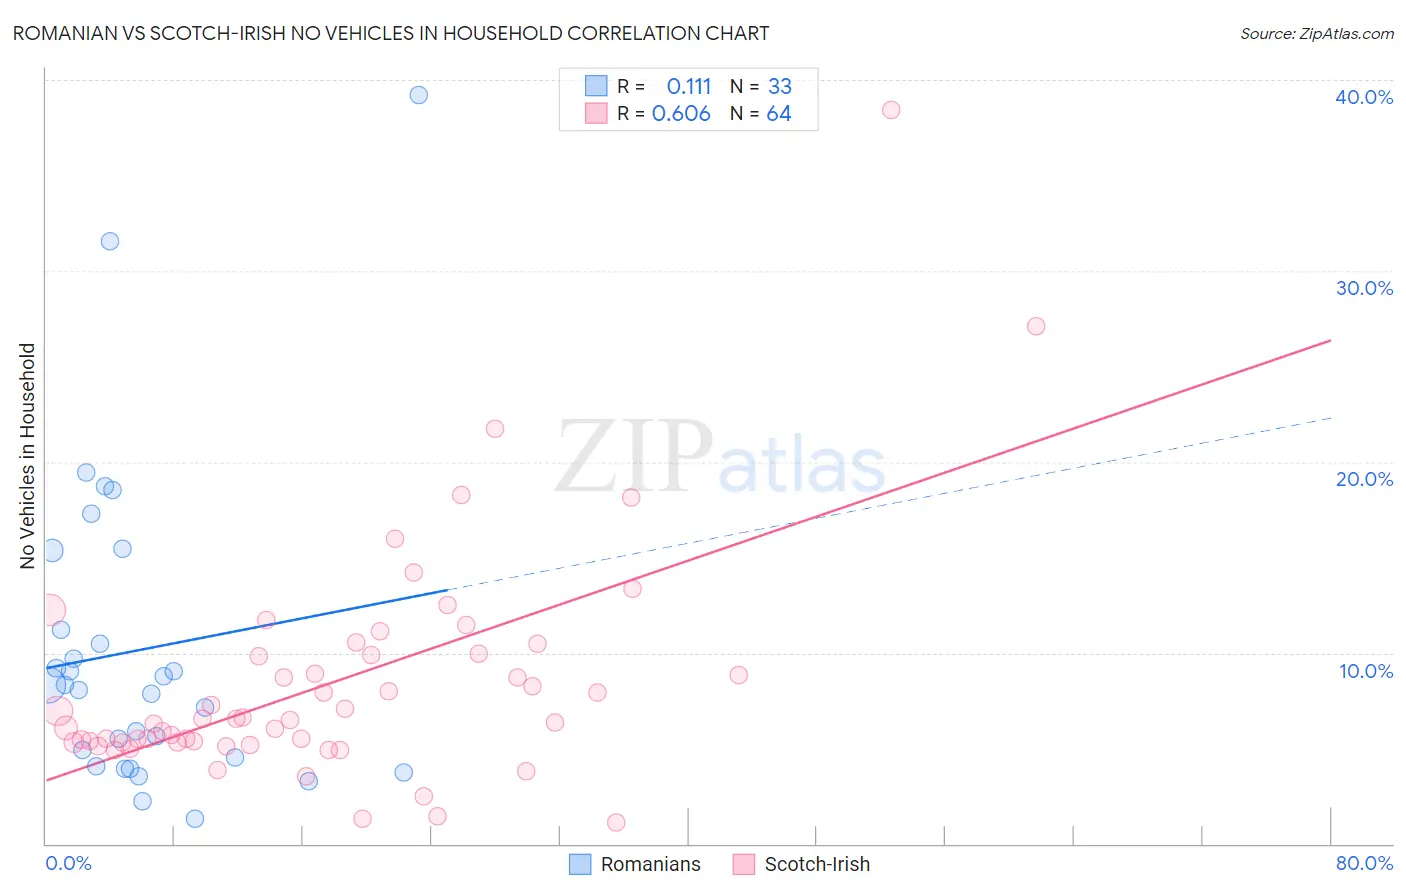
Romanian vs Scotch-Irish No Vehicles in Household Correlation Chart
The statistical analysis conducted on geographies consisting of 377,027,311 people shows a poor positive correlation between the proportion of Romanians and percentage of households with no vehicle available in the United States with a correlation coefficient (R) of 0.111 and weighted average of 10.9%. Similarly, the statistical analysis conducted on geographies consisting of 544,331,951 people shows a significant positive correlation between the proportion of Scotch-Irish and percentage of households with no vehicle available in the United States with a correlation coefficient (R) of 0.606 and weighted average of 6.8%, a difference of 60.7%.
No Vehicles in Household Correlation Summary
| Measurement | Romanian | Scotch-Irish |
| Minimum | 1.3% | 1.1% |
| Maximum | 39.2% | 38.5% |
| Range | 37.9% | 37.4% |
| Mean | 10.2% | 8.4% |
| Median | 8.3% | 6.5% |
| Interquartile 25% (IQ1) | 4.3% | 5.3% |
| Interquartile 75% (IQ3) | 13.3% | 9.9% |
| Interquartile Range (IQR) | 9.0% | 4.6% |
| Standard Deviation (Sample) | 8.2% | 6.0% |
| Standard Deviation (Population) | 8.1% | 6.0% |
Similar Demographics by No Vehicles in Household
Demographics Similar to Romanians by No Vehicles in Household
In terms of no vehicles in household, the demographic groups most similar to Romanians are Iroquois (10.9%, a difference of 0.070%), Immigrants from Western Europe (10.9%, a difference of 0.27%), Cambodian (10.9%, a difference of 0.38%), Guatemalan (11.0%, a difference of 0.41%), and Immigrants from Chile (11.0%, a difference of 0.45%).
| Demographics | Rating | Rank | No Vehicles in Household |
| Immigrants | Brazil | 26.3 /100 | #195 | Fair 10.8% |
| Central Americans | 24.3 /100 | #196 | Fair 10.8% |
| Shoshone | 24.1 /100 | #197 | Fair 10.8% |
| Immigrants | Sweden | 22.9 /100 | #198 | Fair 10.8% |
| Immigrants | Asia | 21.3 /100 | #199 | Fair 10.9% |
| Cambodians | 19.6 /100 | #200 | Poor 10.9% |
| Immigrants | Western Europe | 19.1 /100 | #201 | Poor 10.9% |
| Romanians | 17.9 /100 | #202 | Poor 10.9% |
| Iroquois | 17.6 /100 | #203 | Poor 10.9% |
| Guatemalans | 16.1 /100 | #204 | Poor 11.0% |
| Immigrants | Chile | 15.9 /100 | #205 | Poor 11.0% |
| Somalis | 15.9 /100 | #206 | Poor 11.0% |
| Sierra Leoneans | 15.7 /100 | #207 | Poor 11.0% |
| Immigrants | Italy | 15.6 /100 | #208 | Poor 11.0% |
| Pennsylvania Germans | 15.5 /100 | #209 | Poor 11.0% |
Demographics Similar to Scotch-Irish by No Vehicles in Household
In terms of no vehicles in household, the demographic groups most similar to Scotch-Irish are Swedish (6.8%, a difference of 0.21%), Dutch (6.8%, a difference of 0.51%), Scottish (6.8%, a difference of 0.68%), Czech (6.9%, a difference of 1.1%), and German (6.7%, a difference of 2.0%).
| Demographics | Rating | Rank | No Vehicles in Household |
| Norwegians | 100.0 /100 | #2 | Exceptional 6.4% |
| English | 100.0 /100 | #3 | Exceptional 6.5% |
| Danes | 100.0 /100 | #4 | Exceptional 6.6% |
| Yakama | 100.0 /100 | #5 | Exceptional 6.6% |
| Germans | 100.0 /100 | #6 | Exceptional 6.7% |
| Scottish | 100.0 /100 | #7 | Exceptional 6.8% |
| Swedes | 100.0 /100 | #8 | Exceptional 6.8% |
| Scotch-Irish | 100.0 /100 | #9 | Exceptional 6.8% |
| Dutch | 100.0 /100 | #10 | Exceptional 6.8% |
| Czechs | 100.0 /100 | #11 | Exceptional 6.9% |
| Assyrians/Chaldeans/Syriacs | 100.0 /100 | #12 | Exceptional 7.0% |
| Scandinavians | 100.0 /100 | #13 | Exceptional 7.0% |
| Mexicans | 100.0 /100 | #14 | Exceptional 7.0% |
| Whites/Caucasians | 100.0 /100 | #15 | Exceptional 7.0% |
| Europeans | 100.0 /100 | #16 | Exceptional 7.1% |