Kiowa vs Immigrants from Zaire No Vehicles in Household
COMPARE
Kiowa
Immigrants from Zaire
No Vehicles in Household
No Vehicles in Household Comparison
Kiowa
Immigrants from Zaire
11.5%
NO VEHICLES IN HOUSEHOLD
4.0/ 100
METRIC RATING
235th/ 347
METRIC RANK
11.2%
NO VEHICLES IN HOUSEHOLD
9.6/ 100
METRIC RATING
220th/ 347
METRIC RANK
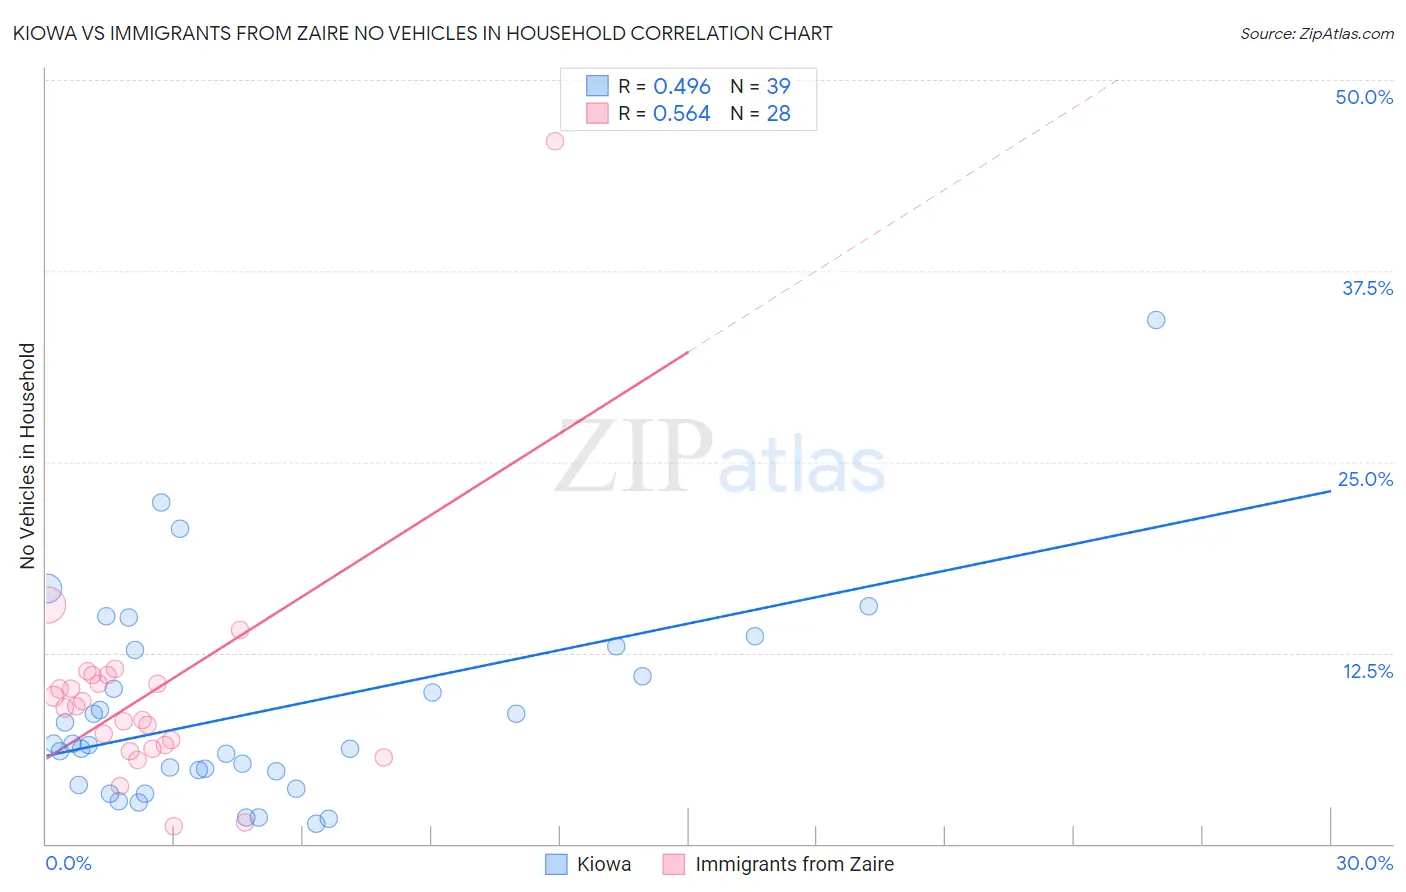
Kiowa vs Immigrants from Zaire No Vehicles in Household Correlation Chart
The statistical analysis conducted on geographies consisting of 56,075,715 people shows a moderate positive correlation between the proportion of Kiowa and percentage of households with no vehicle available in the United States with a correlation coefficient (R) of 0.496 and weighted average of 11.5%. Similarly, the statistical analysis conducted on geographies consisting of 107,219,948 people shows a substantial positive correlation between the proportion of Immigrants from Zaire and percentage of households with no vehicle available in the United States with a correlation coefficient (R) of 0.564 and weighted average of 11.2%, a difference of 3.0%.
No Vehicles in Household Correlation Summary
| Measurement | Kiowa | Immigrants from Zaire |
| Minimum | 1.3% | 1.2% |
| Maximum | 34.3% | 46.0% |
| Range | 33.0% | 44.8% |
| Mean | 8.7% | 9.7% |
| Median | 6.4% | 9.0% |
| Interquartile 25% (IQ1) | 3.8% | 6.4% |
| Interquartile 75% (IQ3) | 12.7% | 10.8% |
| Interquartile Range (IQR) | 8.8% | 4.4% |
| Standard Deviation (Sample) | 6.7% | 7.8% |
| Standard Deviation (Population) | 6.7% | 7.7% |
Demographics Similar to Kiowa and Immigrants from Zaire by No Vehicles in Household
In terms of no vehicles in household, the demographic groups most similar to Kiowa are Cree (11.6%, a difference of 0.35%), Immigrants from Peru (11.5%, a difference of 0.38%), Houma (11.5%, a difference of 0.57%), Ute (11.6%, a difference of 0.59%), and Immigrants from Turkey (11.5%, a difference of 0.61%). Similarly, the demographic groups most similar to Immigrants from Zaire are Argentinean (11.2%, a difference of 0.010%), Immigrants from Guatemala (11.2%, a difference of 0.14%), Dutch West Indian (11.2%, a difference of 0.24%), Peruvian (11.2%, a difference of 0.45%), and Immigrants from South America (11.3%, a difference of 0.60%).
| Demographics | Rating | Rank | No Vehicles in Household |
| Dutch West Indians | 10.2 /100 | #217 | Poor 11.2% |
| Immigrants | Guatemala | 10.0 /100 | #218 | Tragic 11.2% |
| Argentineans | 9.6 /100 | #219 | Tragic 11.2% |
| Immigrants | Zaire | 9.6 /100 | #220 | Tragic 11.2% |
| Peruvians | 8.4 /100 | #221 | Tragic 11.2% |
| Immigrants | South America | 8.0 /100 | #222 | Tragic 11.3% |
| Uruguayans | 7.7 /100 | #223 | Tragic 11.3% |
| Immigrants | Hong Kong | 7.2 /100 | #224 | Tragic 11.3% |
| Immigrants | Sierra Leone | 6.4 /100 | #225 | Tragic 11.3% |
| Immigrants | Somalia | 5.4 /100 | #226 | Tragic 11.4% |
| Immigrants | Pakistan | 5.4 /100 | #227 | Tragic 11.4% |
| Immigrants | Romania | 5.3 /100 | #228 | Tragic 11.4% |
| Ugandans | 5.3 /100 | #229 | Tragic 11.4% |
| Immigrants | Norway | 5.1 /100 | #230 | Tragic 11.4% |
| Immigrants | Japan | 5.1 /100 | #231 | Tragic 11.4% |
| Immigrants | Turkey | 4.8 /100 | #232 | Tragic 11.5% |
| Houma | 4.7 /100 | #233 | Tragic 11.5% |
| Immigrants | Peru | 4.5 /100 | #234 | Tragic 11.5% |
| Kiowa | 4.0 /100 | #235 | Tragic 11.5% |
| Cree | 3.5 /100 | #236 | Tragic 11.6% |
| Ute | 3.3 /100 | #237 | Tragic 11.6% |