Romanian vs Immigrants from Costa Rica No Vehicles in Household
COMPARE
Romanian
Immigrants from Costa Rica
No Vehicles in Household
No Vehicles in Household Comparison
Romanians
Immigrants from Costa Rica
10.9%
NO VEHICLES IN HOUSEHOLD
17.9/ 100
METRIC RATING
202nd/ 347
METRIC RANK
10.3%
NO VEHICLES IN HOUSEHOLD
60.5/ 100
METRIC RATING
166th/ 347
METRIC RANK
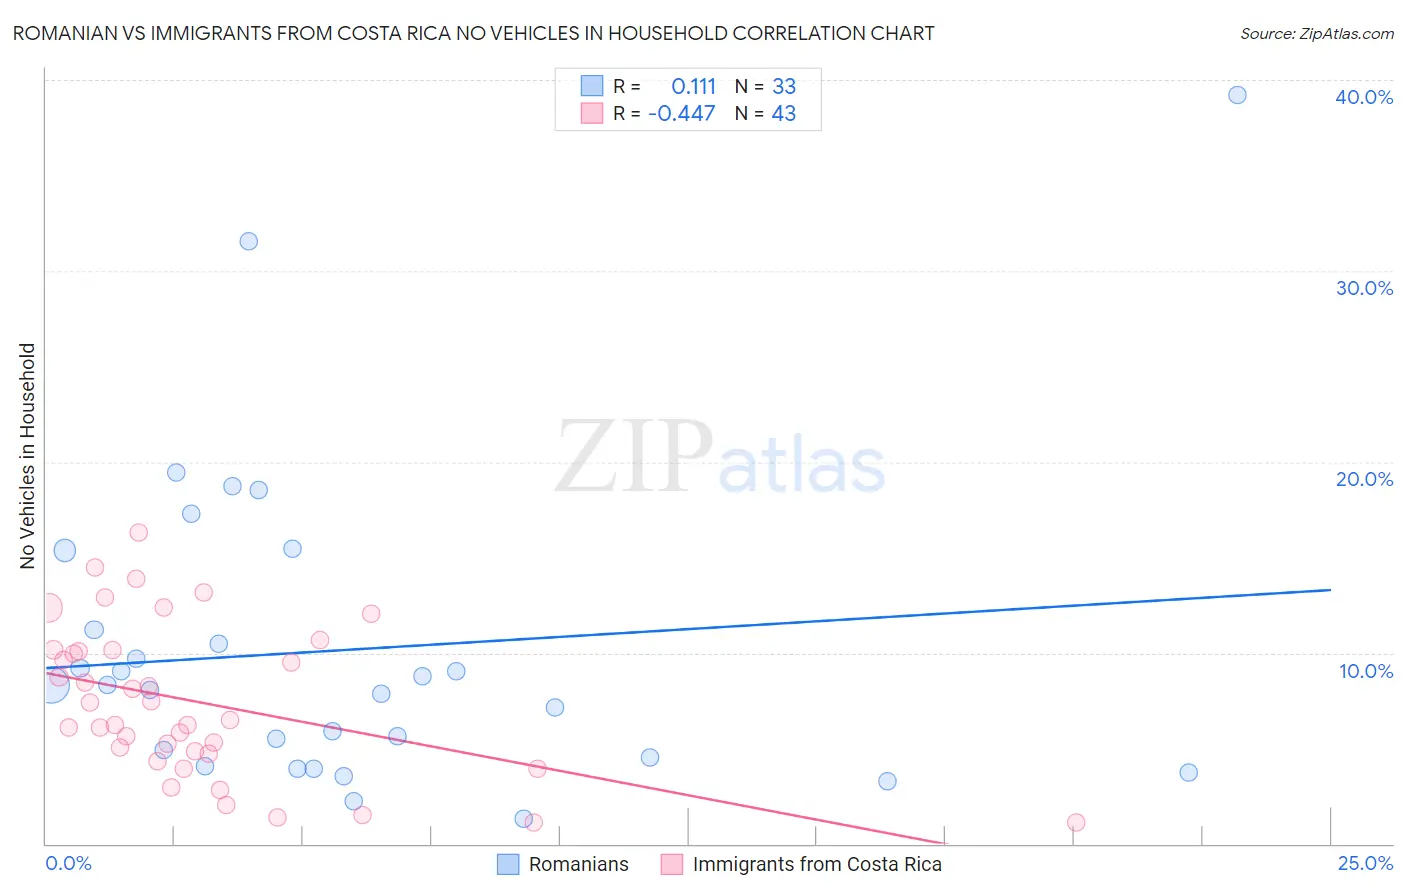
Romanian vs Immigrants from Costa Rica No Vehicles in Household Correlation Chart
The statistical analysis conducted on geographies consisting of 377,027,311 people shows a poor positive correlation between the proportion of Romanians and percentage of households with no vehicle available in the United States with a correlation coefficient (R) of 0.111 and weighted average of 10.9%. Similarly, the statistical analysis conducted on geographies consisting of 204,170,625 people shows a moderate negative correlation between the proportion of Immigrants from Costa Rica and percentage of households with no vehicle available in the United States with a correlation coefficient (R) of -0.447 and weighted average of 10.3%, a difference of 6.7%.
No Vehicles in Household Correlation Summary
| Measurement | Romanian | Immigrants from Costa Rica |
| Minimum | 1.3% | 1.1% |
| Maximum | 39.2% | 16.3% |
| Range | 37.9% | 15.2% |
| Mean | 10.2% | 7.4% |
| Median | 8.3% | 6.5% |
| Interquartile 25% (IQ1) | 4.3% | 4.7% |
| Interquartile 75% (IQ3) | 13.3% | 10.1% |
| Interquartile Range (IQR) | 9.0% | 5.5% |
| Standard Deviation (Sample) | 8.2% | 3.9% |
| Standard Deviation (Population) | 8.1% | 3.9% |
Similar Demographics by No Vehicles in Household
Demographics Similar to Romanians by No Vehicles in Household
In terms of no vehicles in household, the demographic groups most similar to Romanians are Iroquois (10.9%, a difference of 0.070%), Immigrants from Western Europe (10.9%, a difference of 0.27%), Cambodian (10.9%, a difference of 0.38%), Guatemalan (11.0%, a difference of 0.41%), and Immigrants from Chile (11.0%, a difference of 0.45%).
| Demographics | Rating | Rank | No Vehicles in Household |
| Immigrants | Brazil | 26.3 /100 | #195 | Fair 10.8% |
| Central Americans | 24.3 /100 | #196 | Fair 10.8% |
| Shoshone | 24.1 /100 | #197 | Fair 10.8% |
| Immigrants | Sweden | 22.9 /100 | #198 | Fair 10.8% |
| Immigrants | Asia | 21.3 /100 | #199 | Fair 10.9% |
| Cambodians | 19.6 /100 | #200 | Poor 10.9% |
| Immigrants | Western Europe | 19.1 /100 | #201 | Poor 10.9% |
| Romanians | 17.9 /100 | #202 | Poor 10.9% |
| Iroquois | 17.6 /100 | #203 | Poor 10.9% |
| Guatemalans | 16.1 /100 | #204 | Poor 11.0% |
| Immigrants | Chile | 15.9 /100 | #205 | Poor 11.0% |
| Somalis | 15.9 /100 | #206 | Poor 11.0% |
| Sierra Leoneans | 15.7 /100 | #207 | Poor 11.0% |
| Immigrants | Italy | 15.6 /100 | #208 | Poor 11.0% |
| Pennsylvania Germans | 15.5 /100 | #209 | Poor 11.0% |
Demographics Similar to Immigrants from Costa Rica by No Vehicles in Household
In terms of no vehicles in household, the demographic groups most similar to Immigrants from Costa Rica are Comanche (10.2%, a difference of 0.050%), South African (10.2%, a difference of 0.10%), Immigrants from Saudi Arabia (10.3%, a difference of 0.24%), Immigrants from Cambodia (10.2%, a difference of 0.47%), and Indonesian (10.3%, a difference of 0.54%).
| Demographics | Rating | Rank | No Vehicles in Household |
| Immigrants | Indonesia | 69.3 /100 | #159 | Good 10.1% |
| Immigrants | Middle Africa | 65.7 /100 | #160 | Good 10.2% |
| New Zealanders | 65.1 /100 | #161 | Good 10.2% |
| Immigrants | Austria | 64.4 /100 | #162 | Good 10.2% |
| Immigrants | Cambodia | 63.7 /100 | #163 | Good 10.2% |
| South Africans | 61.1 /100 | #164 | Good 10.2% |
| Comanche | 60.8 /100 | #165 | Good 10.2% |
| Immigrants | Costa Rica | 60.5 /100 | #166 | Good 10.3% |
| Immigrants | Saudi Arabia | 58.8 /100 | #167 | Average 10.3% |
| Indonesians | 56.7 /100 | #168 | Average 10.3% |
| Lumbee | 54.7 /100 | #169 | Average 10.3% |
| Immigrants | Latin America | 53.2 /100 | #170 | Average 10.4% |
| Hmong | 52.7 /100 | #171 | Average 10.4% |
| Brazilians | 51.7 /100 | #172 | Average 10.4% |
| Filipinos | 50.1 /100 | #173 | Average 10.4% |