Romanian vs Immigrants from Nepal No Vehicles in Household
COMPARE
Romanian
Immigrants from Nepal
No Vehicles in Household
No Vehicles in Household Comparison
Romanians
Immigrants from Nepal
10.9%
NO VEHICLES IN HOUSEHOLD
17.9/ 100
METRIC RATING
202nd/ 347
METRIC RANK
10.5%
NO VEHICLES IN HOUSEHOLD
42.4/ 100
METRIC RATING
184th/ 347
METRIC RANK
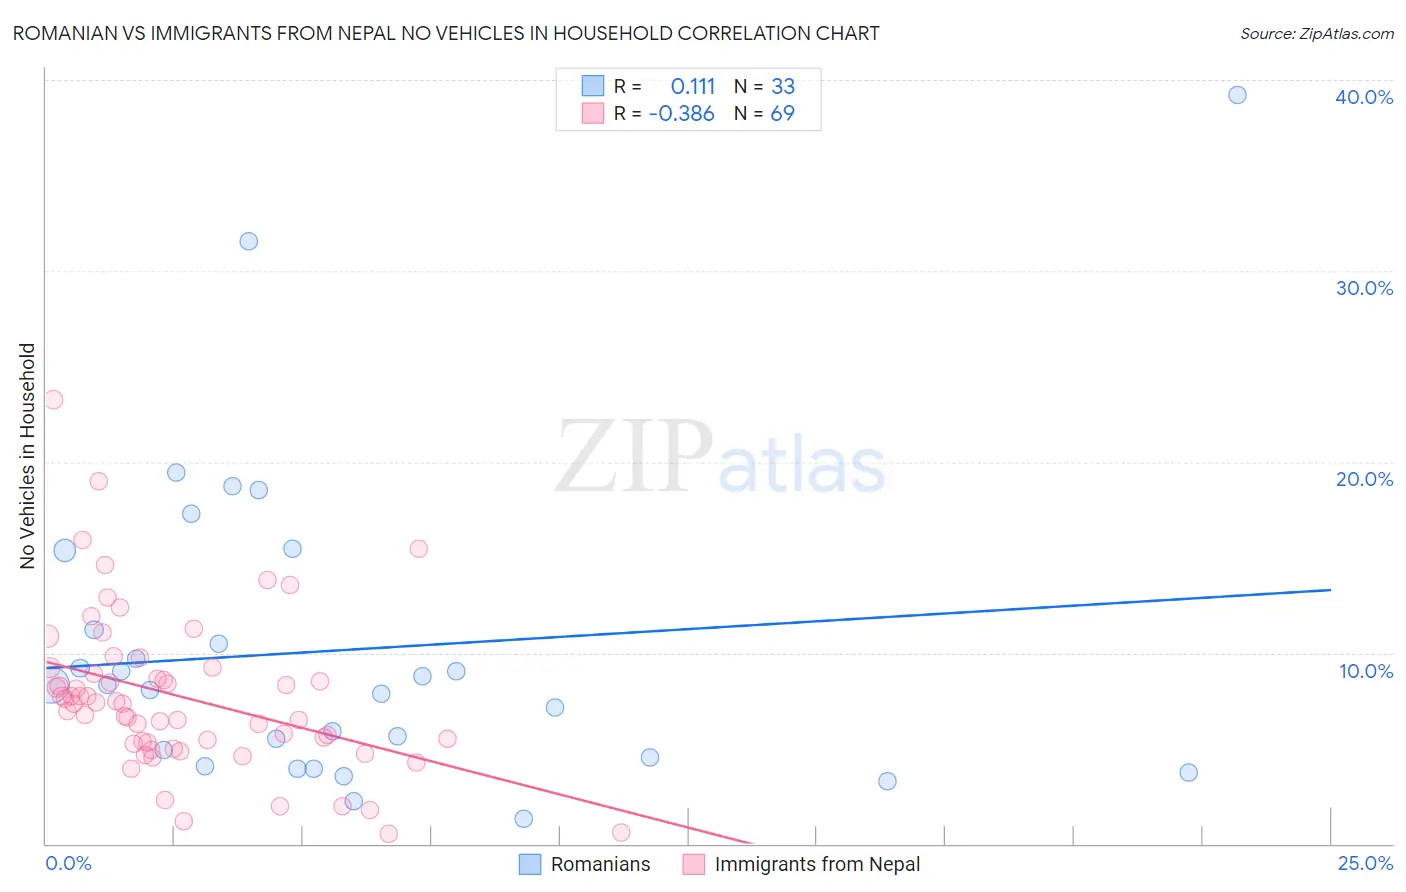
Romanian vs Immigrants from Nepal No Vehicles in Household Correlation Chart
The statistical analysis conducted on geographies consisting of 377,027,311 people shows a poor positive correlation between the proportion of Romanians and percentage of households with no vehicle available in the United States with a correlation coefficient (R) of 0.111 and weighted average of 10.9%. Similarly, the statistical analysis conducted on geographies consisting of 186,377,991 people shows a mild negative correlation between the proportion of Immigrants from Nepal and percentage of households with no vehicle available in the United States with a correlation coefficient (R) of -0.386 and weighted average of 10.5%, a difference of 4.1%.
No Vehicles in Household Correlation Summary
| Measurement | Romanian | Immigrants from Nepal |
| Minimum | 1.3% | 0.50% |
| Maximum | 39.2% | 23.2% |
| Range | 37.9% | 22.7% |
| Mean | 10.2% | 7.7% |
| Median | 8.3% | 7.3% |
| Interquartile 25% (IQ1) | 4.3% | 5.3% |
| Interquartile 75% (IQ3) | 13.3% | 9.1% |
| Interquartile Range (IQR) | 9.0% | 3.8% |
| Standard Deviation (Sample) | 8.2% | 4.1% |
| Standard Deviation (Population) | 8.1% | 4.1% |
Demographics Similar to Romanians and Immigrants from Nepal by No Vehicles in Household
In terms of no vehicles in household, the demographic groups most similar to Romanians are Iroquois (10.9%, a difference of 0.070%), Immigrants from Western Europe (10.9%, a difference of 0.27%), Cambodian (10.9%, a difference of 0.38%), Immigrants from Asia (10.9%, a difference of 0.71%), and Immigrants from Sweden (10.8%, a difference of 1.0%). Similarly, the demographic groups most similar to Immigrants from Nepal are South American (10.5%, a difference of 0.070%), Native/Alaskan (10.5%, a difference of 0.17%), German Russian (10.5%, a difference of 0.25%), Immigrants from Poland (10.6%, a difference of 0.56%), and Immigrants from Armenia (10.6%, a difference of 0.69%).
| Demographics | Rating | Rank | No Vehicles in Household |
| Natives/Alaskans | 43.7 /100 | #183 | Average 10.5% |
| Immigrants | Nepal | 42.4 /100 | #184 | Average 10.5% |
| South Americans | 41.9 /100 | #185 | Average 10.5% |
| German Russians | 40.6 /100 | #186 | Average 10.5% |
| Immigrants | Poland | 38.4 /100 | #187 | Fair 10.6% |
| Immigrants | Armenia | 37.5 /100 | #188 | Fair 10.6% |
| Immigrants | Eritrea | 36.3 /100 | #189 | Fair 10.6% |
| Immigrants | North Macedonia | 34.6 /100 | #190 | Fair 10.6% |
| Immigrants | Northern Europe | 33.1 /100 | #191 | Fair 10.7% |
| Carpatho Rusyns | 32.1 /100 | #192 | Fair 10.7% |
| Ukrainians | 28.0 /100 | #193 | Fair 10.7% |
| Pueblo | 27.0 /100 | #194 | Fair 10.8% |
| Immigrants | Brazil | 26.3 /100 | #195 | Fair 10.8% |
| Central Americans | 24.3 /100 | #196 | Fair 10.8% |
| Shoshone | 24.1 /100 | #197 | Fair 10.8% |
| Immigrants | Sweden | 22.9 /100 | #198 | Fair 10.8% |
| Immigrants | Asia | 21.3 /100 | #199 | Fair 10.9% |
| Cambodians | 19.6 /100 | #200 | Poor 10.9% |
| Immigrants | Western Europe | 19.1 /100 | #201 | Poor 10.9% |
| Romanians | 17.9 /100 | #202 | Poor 10.9% |
| Iroquois | 17.6 /100 | #203 | Poor 10.9% |