Puerto Rican vs Immigrants from Lebanon 4 or more Vehicles in Household
COMPARE
Puerto Rican
Immigrants from Lebanon
4 or more Vehicles in Household
4 or more Vehicles in Household Comparison
Puerto Ricans
Immigrants from Lebanon
4.7%
4 OR MORE VEHICLES IN HOUSEHOLD
0.0/ 100
METRIC RATING
316th/ 347
METRIC RANK
6.3%
4 OR MORE VEHICLES IN HOUSEHOLD
51.7/ 100
METRIC RATING
172nd/ 347
METRIC RANK
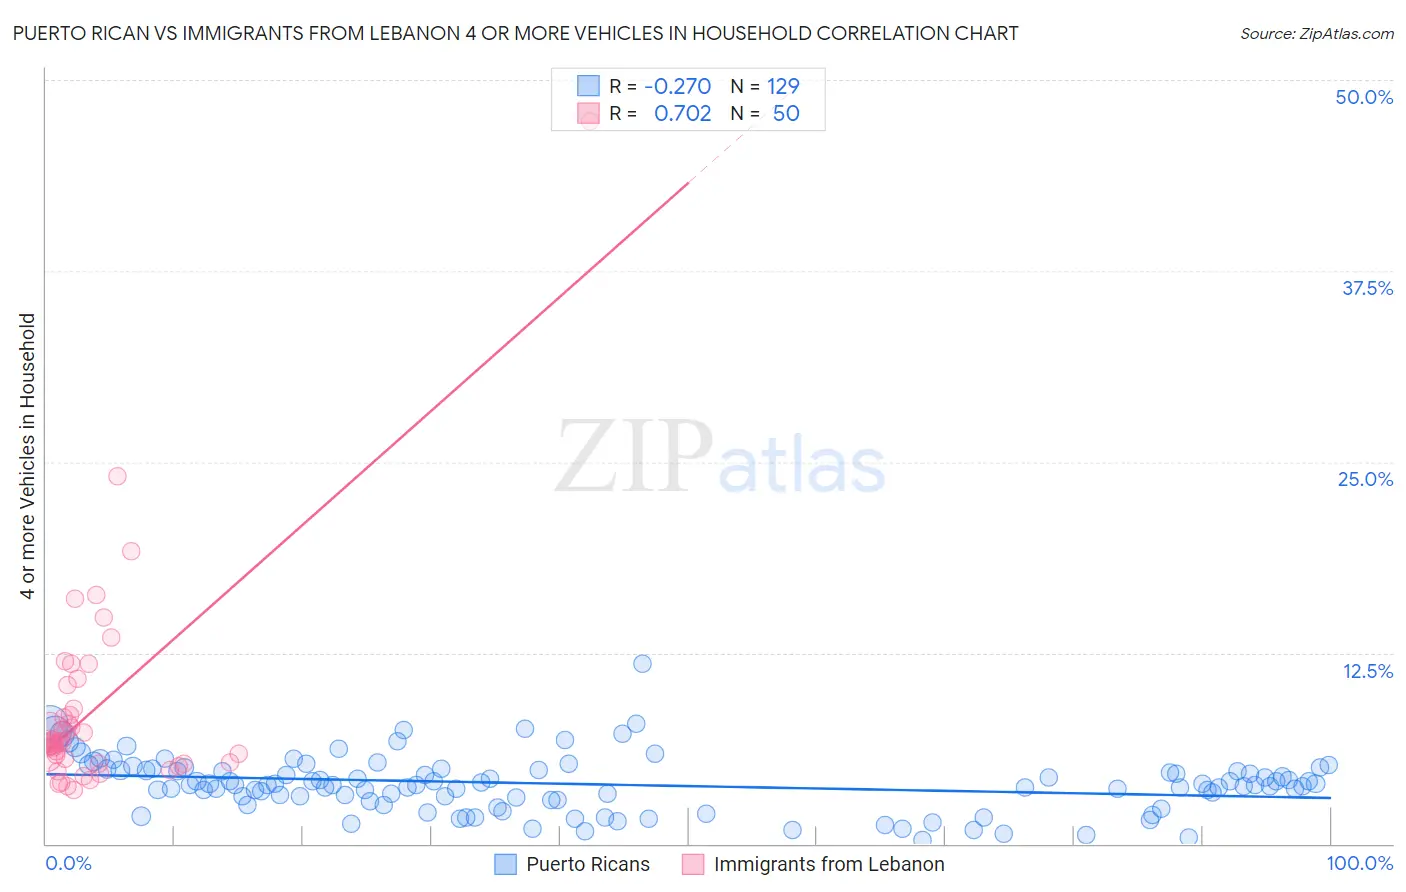
Puerto Rican vs Immigrants from Lebanon 4 or more Vehicles in Household Correlation Chart
The statistical analysis conducted on geographies consisting of 525,186,589 people shows a weak negative correlation between the proportion of Puerto Ricans and percentage of households with 4 or more vehicles available in the United States with a correlation coefficient (R) of -0.270 and weighted average of 4.7%. Similarly, the statistical analysis conducted on geographies consisting of 216,708,139 people shows a strong positive correlation between the proportion of Immigrants from Lebanon and percentage of households with 4 or more vehicles available in the United States with a correlation coefficient (R) of 0.702 and weighted average of 6.3%, a difference of 34.2%.
4 or more Vehicles in Household Correlation Summary
| Measurement | Puerto Rican | Immigrants from Lebanon |
| Minimum | 0.24% | 3.5% |
| Maximum | 11.8% | 47.3% |
| Range | 11.5% | 43.7% |
| Mean | 3.9% | 8.8% |
| Median | 3.8% | 6.6% |
| Interquartile 25% (IQ1) | 2.9% | 5.3% |
| Interquartile 75% (IQ3) | 4.9% | 8.8% |
| Interquartile Range (IQR) | 2.0% | 3.6% |
| Standard Deviation (Sample) | 1.8% | 7.0% |
| Standard Deviation (Population) | 1.8% | 6.9% |
Similar Demographics by 4 or more Vehicles in Household
Demographics Similar to Puerto Ricans by 4 or more Vehicles in Household
In terms of 4 or more vehicles in household, the demographic groups most similar to Puerto Ricans are Immigrants from Belarus (4.7%, a difference of 0.44%), Immigrants from West Indies (4.7%, a difference of 0.53%), Immigrants from Israel (4.8%, a difference of 1.3%), Albanian (4.8%, a difference of 1.3%), and U.S. Virgin Islander (4.6%, a difference of 1.7%).
| Demographics | Rating | Rank | 4 or more Vehicles in Household |
| Immigrants | Somalia | 0.0 /100 | #309 | Tragic 4.9% |
| Moroccans | 0.0 /100 | #310 | Tragic 4.9% |
| Houma | 0.0 /100 | #311 | Tragic 4.9% |
| Albanians | 0.0 /100 | #312 | Tragic 4.8% |
| Immigrants | Israel | 0.0 /100 | #313 | Tragic 4.8% |
| Immigrants | West Indies | 0.0 /100 | #314 | Tragic 4.7% |
| Immigrants | Belarus | 0.0 /100 | #315 | Tragic 4.7% |
| Puerto Ricans | 0.0 /100 | #316 | Tragic 4.7% |
| U.S. Virgin Islanders | 0.0 /100 | #317 | Tragic 4.6% |
| Jamaicans | 0.0 /100 | #318 | Tragic 4.6% |
| Haitians | 0.0 /100 | #319 | Tragic 4.6% |
| Immigrants | Haiti | 0.0 /100 | #320 | Tragic 4.5% |
| Ecuadorians | 0.0 /100 | #321 | Tragic 4.5% |
| Immigrants | Yemen | 0.0 /100 | #322 | Tragic 4.5% |
| Immigrants | Caribbean | 0.0 /100 | #323 | Tragic 4.4% |
Demographics Similar to Immigrants from Lebanon by 4 or more Vehicles in Household
In terms of 4 or more vehicles in household, the demographic groups most similar to Immigrants from Lebanon are Immigrants from India (6.3%, a difference of 0.020%), Slovene (6.3%, a difference of 0.060%), Immigrants from Syria (6.3%, a difference of 0.11%), Lithuanian (6.3%, a difference of 0.17%), and Immigrants from Western Europe (6.3%, a difference of 0.29%).
| Demographics | Rating | Rank | 4 or more Vehicles in Household |
| Immigrants | Peru | 59.8 /100 | #165 | Average 6.4% |
| Immigrants | Denmark | 57.8 /100 | #166 | Average 6.4% |
| Poles | 56.9 /100 | #167 | Average 6.4% |
| Lebanese | 55.8 /100 | #168 | Average 6.4% |
| Estonians | 55.1 /100 | #169 | Average 6.4% |
| Immigrants | Syria | 52.8 /100 | #170 | Average 6.3% |
| Immigrants | India | 51.9 /100 | #171 | Average 6.3% |
| Immigrants | Lebanon | 51.7 /100 | #172 | Average 6.3% |
| Slovenes | 51.1 /100 | #173 | Average 6.3% |
| Lithuanians | 50.0 /100 | #174 | Average 6.3% |
| Immigrants | Western Europe | 48.8 /100 | #175 | Average 6.3% |
| Ukrainians | 47.6 /100 | #176 | Average 6.3% |
| Slovaks | 46.9 /100 | #177 | Average 6.3% |
| Belizeans | 44.5 /100 | #178 | Average 6.3% |
| Immigrants | Japan | 43.1 /100 | #179 | Average 6.3% |