Pima vs Finnish Disability Age 18 to 34
COMPARE
Pima
Finnish
Disability Age 18 to 34
Disability Age 18 to 34 Comparison
Pima
Finns
7.7%
DISABILITY AGE 18 TO 34
0.0/ 100
METRIC RATING
301st/ 347
METRIC RANK
7.8%
DISABILITY AGE 18 TO 34
0.0/ 100
METRIC RATING
310th/ 347
METRIC RANK
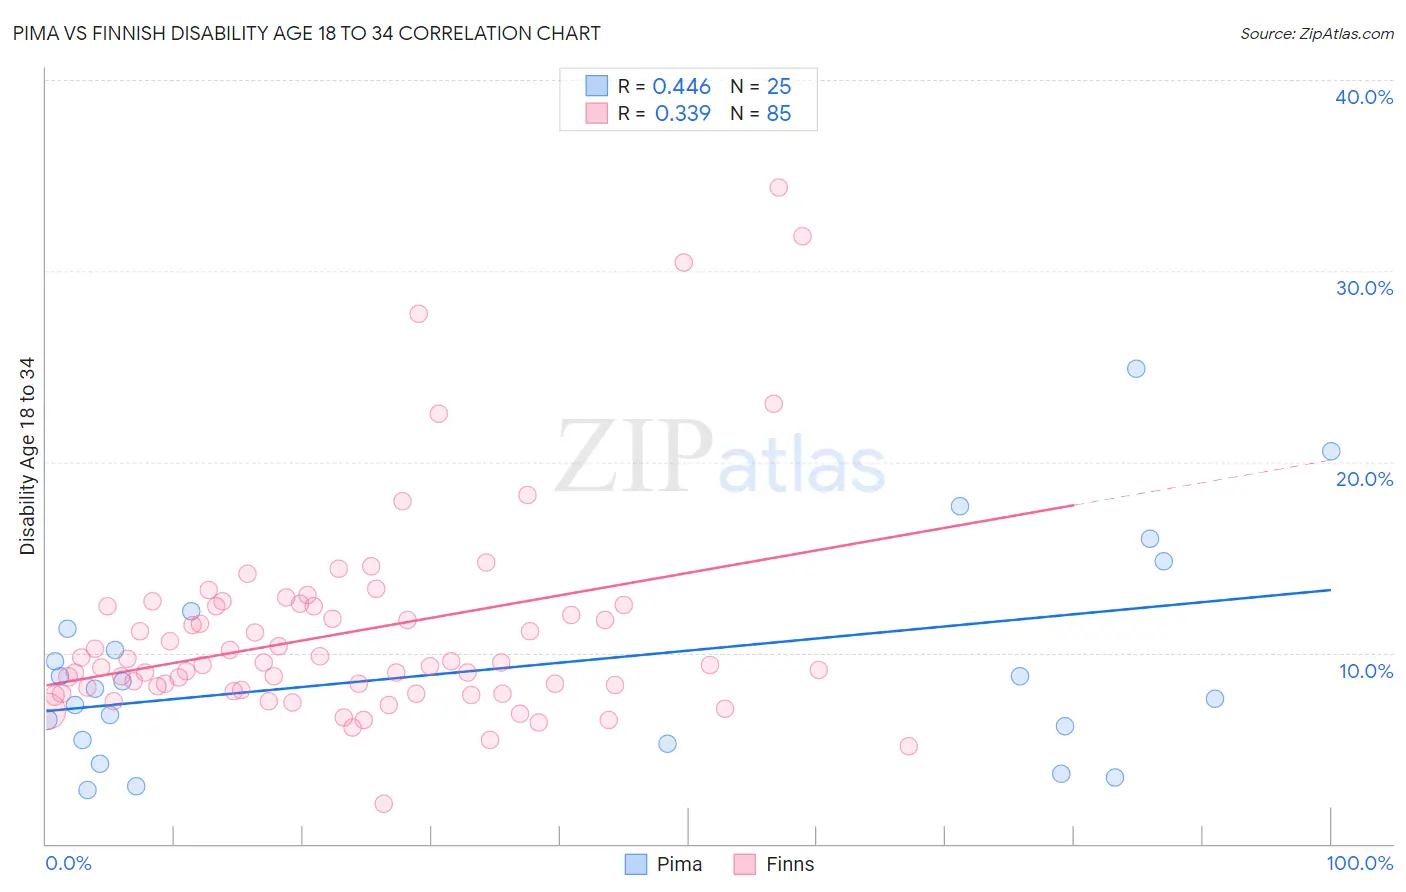
Pima vs Finnish Disability Age 18 to 34 Correlation Chart
The statistical analysis conducted on geographies consisting of 61,478,935 people shows a moderate positive correlation between the proportion of Pima and percentage of population with a disability between the ages 18 and 35 in the United States with a correlation coefficient (R) of 0.446 and weighted average of 7.7%. Similarly, the statistical analysis conducted on geographies consisting of 403,137,976 people shows a mild positive correlation between the proportion of Finns and percentage of population with a disability between the ages 18 and 35 in the United States with a correlation coefficient (R) of 0.339 and weighted average of 7.8%, a difference of 1.0%.
Disability Age 18 to 34 Correlation Summary
| Measurement | Pima | Finnish |
| Minimum | 2.8% | 2.1% |
| Maximum | 24.9% | 34.4% |
| Range | 22.1% | 32.3% |
| Mean | 9.3% | 11.1% |
| Median | 8.1% | 9.4% |
| Interquartile 25% (IQ1) | 5.3% | 8.0% |
| Interquartile 75% (IQ3) | 11.7% | 12.4% |
| Interquartile Range (IQR) | 6.4% | 4.4% |
| Standard Deviation (Sample) | 5.7% | 5.6% |
| Standard Deviation (Population) | 5.5% | 5.6% |
Demographics Similar to Pima and Finns by Disability Age 18 to 34
In terms of disability age 18 to 34, the demographic groups most similar to Pima are Scottish (7.7%, a difference of 0.060%), Welsh (7.7%, a difference of 0.070%), German (7.7%, a difference of 0.080%), Cheyenne (7.7%, a difference of 0.14%), and Dutch (7.7%, a difference of 0.31%). Similarly, the demographic groups most similar to Finns are Alaska Native (7.8%, a difference of 0.060%), Pennsylvania German (7.8%, a difference of 0.070%), Scotch-Irish (7.8%, a difference of 0.10%), English (7.8%, a difference of 0.35%), and Menominee (7.8%, a difference of 0.44%).
| Demographics | Rating | Rank | Disability Age 18 to 34 |
| Tlingit-Haida | 0.0 /100 | #295 | Tragic 7.7% |
| Cape Verdeans | 0.0 /100 | #296 | Tragic 7.7% |
| Pueblo | 0.0 /100 | #297 | Tragic 7.7% |
| Dutch | 0.0 /100 | #298 | Tragic 7.7% |
| Germans | 0.0 /100 | #299 | Tragic 7.7% |
| Scottish | 0.0 /100 | #300 | Tragic 7.7% |
| Pima | 0.0 /100 | #301 | Tragic 7.7% |
| Welsh | 0.0 /100 | #302 | Tragic 7.7% |
| Cheyenne | 0.0 /100 | #303 | Tragic 7.7% |
| Shoshone | 0.0 /100 | #304 | Tragic 7.8% |
| Menominee | 0.0 /100 | #305 | Tragic 7.8% |
| English | 0.0 /100 | #306 | Tragic 7.8% |
| Scotch-Irish | 0.0 /100 | #307 | Tragic 7.8% |
| Pennsylvania Germans | 0.0 /100 | #308 | Tragic 7.8% |
| Alaska Natives | 0.0 /100 | #309 | Tragic 7.8% |
| Finns | 0.0 /100 | #310 | Tragic 7.8% |
| French | 0.0 /100 | #311 | Tragic 7.9% |
| Spanish Americans | 0.0 /100 | #312 | Tragic 7.9% |
| Iroquois | 0.0 /100 | #313 | Tragic 7.9% |
| Colville | 0.0 /100 | #314 | Tragic 7.9% |
| Americans | 0.0 /100 | #315 | Tragic 8.0% |