Asian vs Latvian 4 or more Vehicles in Household
COMPARE
Asian
Latvian
4 or more Vehicles in Household
4 or more Vehicles in Household Comparison
Asians
Latvians
7.0%
4 OR MORE VEHICLES IN HOUSEHOLD
98.6/ 100
METRIC RATING
102nd/ 347
METRIC RANK
6.1%
4 OR MORE VEHICLES IN HOUSEHOLD
21.7/ 100
METRIC RATING
200th/ 347
METRIC RANK
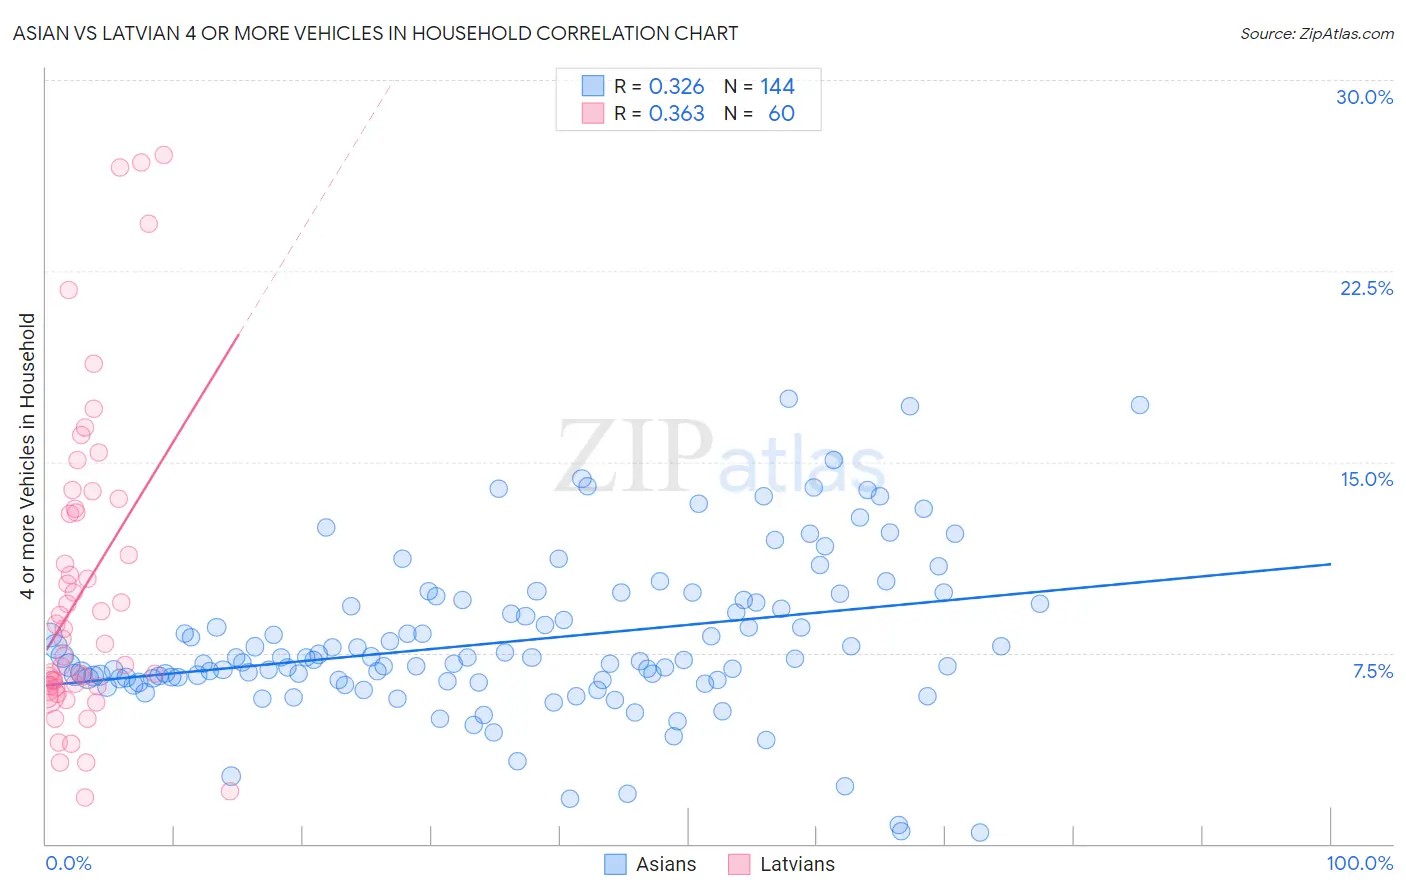
Asian vs Latvian 4 or more Vehicles in Household Correlation Chart
The statistical analysis conducted on geographies consisting of 547,642,894 people shows a mild positive correlation between the proportion of Asians and percentage of households with 4 or more vehicles available in the United States with a correlation coefficient (R) of 0.326 and weighted average of 7.0%. Similarly, the statistical analysis conducted on geographies consisting of 219,878,436 people shows a mild positive correlation between the proportion of Latvians and percentage of households with 4 or more vehicles available in the United States with a correlation coefficient (R) of 0.363 and weighted average of 6.1%, a difference of 14.5%.
4 or more Vehicles in Household Correlation Summary
| Measurement | Asian | Latvian |
| Minimum | 0.45% | 1.8% |
| Maximum | 17.5% | 27.1% |
| Range | 17.0% | 25.3% |
| Mean | 7.9% | 10.0% |
| Median | 7.2% | 8.0% |
| Interquartile 25% (IQ1) | 6.4% | 6.2% |
| Interquartile 75% (IQ3) | 9.5% | 13.1% |
| Interquartile Range (IQR) | 3.0% | 6.9% |
| Standard Deviation (Sample) | 3.1% | 6.1% |
| Standard Deviation (Population) | 3.1% | 6.0% |
Similar Demographics by 4 or more Vehicles in Household
Demographics Similar to Asians by 4 or more Vehicles in Household
In terms of 4 or more vehicles in household, the demographic groups most similar to Asians are Blackfeet (7.0%, a difference of 0.010%), Pakistani (7.0%, a difference of 0.070%), Taiwanese (7.0%, a difference of 0.14%), Seminole (7.0%, a difference of 0.21%), and Hmong (7.0%, a difference of 0.49%).
| Demographics | Rating | Rank | 4 or more Vehicles in Household |
| Czechoslovakians | 99.3 /100 | #95 | Exceptional 7.1% |
| Central Americans | 99.3 /100 | #96 | Exceptional 7.1% |
| Celtics | 99.1 /100 | #97 | Exceptional 7.1% |
| Irish | 99.0 /100 | #98 | Exceptional 7.1% |
| Seminole | 98.8 /100 | #99 | Exceptional 7.0% |
| Taiwanese | 98.7 /100 | #100 | Exceptional 7.0% |
| Pakistanis | 98.7 /100 | #101 | Exceptional 7.0% |
| Asians | 98.6 /100 | #102 | Exceptional 7.0% |
| Blackfeet | 98.6 /100 | #103 | Exceptional 7.0% |
| Hmong | 98.3 /100 | #104 | Exceptional 7.0% |
| German Russians | 98.3 /100 | #105 | Exceptional 7.0% |
| Guatemalans | 98.1 /100 | #106 | Exceptional 7.0% |
| Nicaraguans | 98.0 /100 | #107 | Exceptional 7.0% |
| French | 97.7 /100 | #108 | Exceptional 6.9% |
| Filipinos | 97.6 /100 | #109 | Exceptional 6.9% |
Demographics Similar to Latvians by 4 or more Vehicles in Household
In terms of 4 or more vehicles in household, the demographic groups most similar to Latvians are Immigrants from Norway (6.1%, a difference of 0.0%), Egyptian (6.1%, a difference of 0.050%), Immigrants from South Central Asia (6.1%, a difference of 0.060%), Immigrants from Portugal (6.1%, a difference of 0.090%), and Immigrants from Sierra Leone (6.1%, a difference of 0.20%).
| Demographics | Rating | Rank | 4 or more Vehicles in Household |
| Immigrants | Kuwait | 28.0 /100 | #193 | Fair 6.2% |
| Immigrants | Sweden | 27.0 /100 | #194 | Fair 6.2% |
| Argentineans | 27.0 /100 | #195 | Fair 6.2% |
| Tsimshian | 26.4 /100 | #196 | Fair 6.2% |
| Immigrants | Sri Lanka | 23.7 /100 | #197 | Fair 6.1% |
| Immigrants | Portugal | 22.3 /100 | #198 | Fair 6.1% |
| Immigrants | Norway | 21.8 /100 | #199 | Fair 6.1% |
| Latvians | 21.7 /100 | #200 | Fair 6.1% |
| Egyptians | 21.4 /100 | #201 | Fair 6.1% |
| Immigrants | South Central Asia | 21.3 /100 | #202 | Fair 6.1% |
| Immigrants | Sierra Leone | 20.5 /100 | #203 | Fair 6.1% |
| Immigrants | Belize | 19.8 /100 | #204 | Poor 6.1% |
| Hondurans | 19.3 /100 | #205 | Poor 6.1% |
| Kenyans | 18.5 /100 | #206 | Poor 6.1% |
| Immigrants | Chile | 16.9 /100 | #207 | Poor 6.1% |