Laotian vs Latvian 4 or more Vehicles in Household
COMPARE
Laotian
Latvian
4 or more Vehicles in Household
4 or more Vehicles in Household Comparison
Laotians
Latvians
7.4%
4 OR MORE VEHICLES IN HOUSEHOLD
99.9/ 100
METRIC RATING
76th/ 347
METRIC RANK
6.1%
4 OR MORE VEHICLES IN HOUSEHOLD
21.7/ 100
METRIC RATING
200th/ 347
METRIC RANK
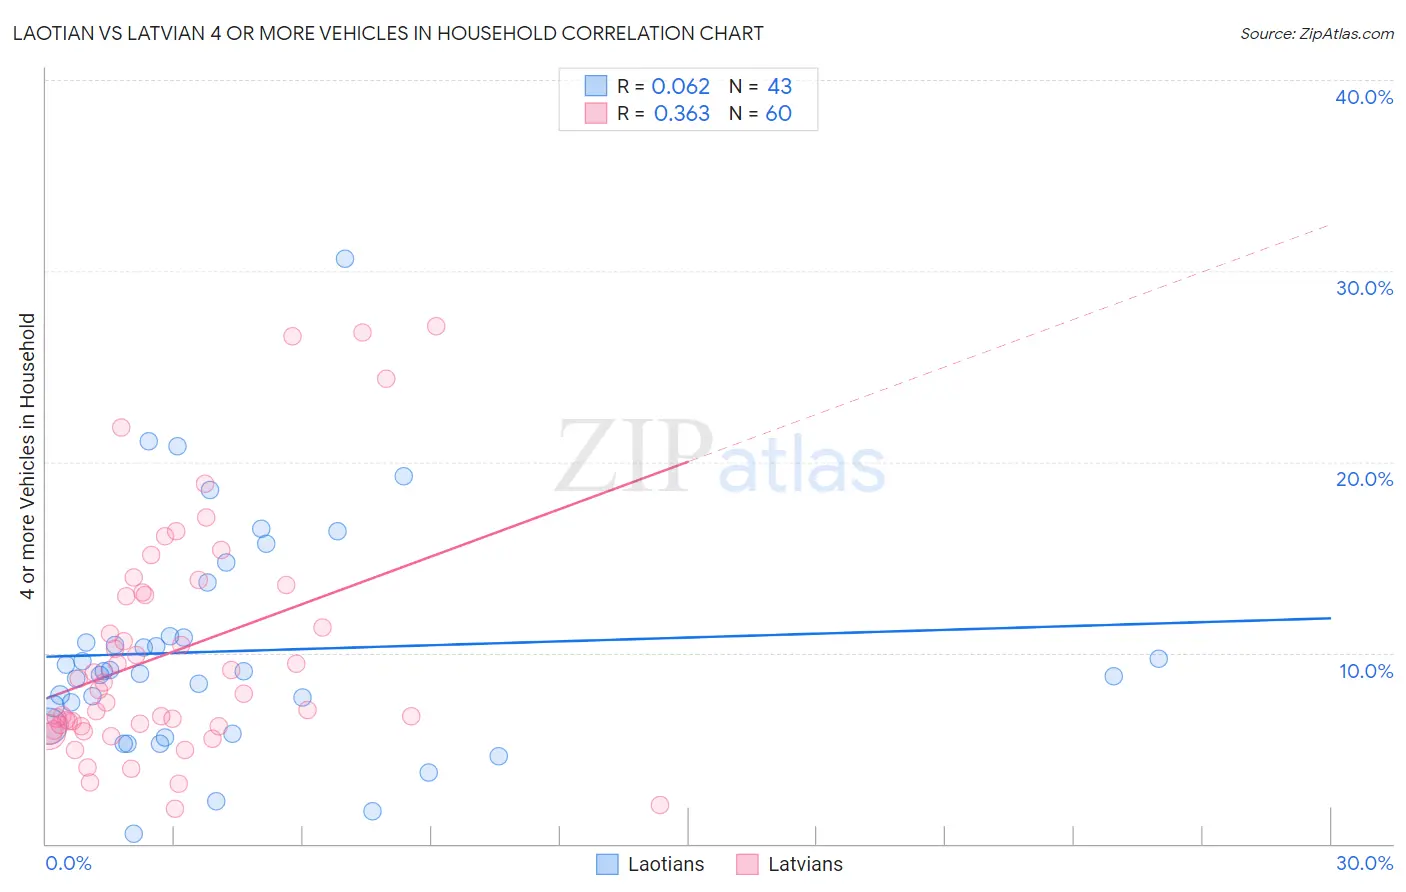
Laotian vs Latvian 4 or more Vehicles in Household Correlation Chart
The statistical analysis conducted on geographies consisting of 224,004,331 people shows a slight positive correlation between the proportion of Laotians and percentage of households with 4 or more vehicles available in the United States with a correlation coefficient (R) of 0.062 and weighted average of 7.4%. Similarly, the statistical analysis conducted on geographies consisting of 219,878,436 people shows a mild positive correlation between the proportion of Latvians and percentage of households with 4 or more vehicles available in the United States with a correlation coefficient (R) of 0.363 and weighted average of 6.1%, a difference of 20.6%.
4 or more Vehicles in Household Correlation Summary
| Measurement | Laotian | Latvian |
| Minimum | 0.54% | 1.8% |
| Maximum | 30.6% | 27.1% |
| Range | 30.1% | 25.3% |
| Mean | 10.1% | 10.0% |
| Median | 9.0% | 8.0% |
| Interquartile 25% (IQ1) | 6.1% | 6.2% |
| Interquartile 75% (IQ3) | 10.8% | 13.1% |
| Interquartile Range (IQR) | 4.7% | 6.9% |
| Standard Deviation (Sample) | 5.8% | 6.1% |
| Standard Deviation (Population) | 5.8% | 6.0% |
Similar Demographics by 4 or more Vehicles in Household
Demographics Similar to Laotians by 4 or more Vehicles in Household
In terms of 4 or more vehicles in household, the demographic groups most similar to Laotians are Icelander (7.4%, a difference of 0.050%), Immigrants from Cambodia (7.4%, a difference of 0.050%), Apache (7.4%, a difference of 0.17%), White/Caucasian (7.4%, a difference of 0.23%), and Portuguese (7.4%, a difference of 0.36%).
| Demographics | Rating | Rank | 4 or more Vehicles in Household |
| Germans | 99.9 /100 | #69 | Exceptional 7.5% |
| Scottish | 99.9 /100 | #70 | Exceptional 7.4% |
| Chickasaw | 99.9 /100 | #71 | Exceptional 7.4% |
| Scotch-Irish | 99.9 /100 | #72 | Exceptional 7.4% |
| Portuguese | 99.9 /100 | #73 | Exceptional 7.4% |
| Icelanders | 99.9 /100 | #74 | Exceptional 7.4% |
| Immigrants | Cambodia | 99.9 /100 | #75 | Exceptional 7.4% |
| Laotians | 99.9 /100 | #76 | Exceptional 7.4% |
| Apache | 99.9 /100 | #77 | Exceptional 7.4% |
| Whites/Caucasians | 99.8 /100 | #78 | Exceptional 7.4% |
| Czechs | 99.8 /100 | #79 | Exceptional 7.4% |
| Alaska Natives | 99.8 /100 | #80 | Exceptional 7.3% |
| Finns | 99.8 /100 | #81 | Exceptional 7.3% |
| Northern Europeans | 99.8 /100 | #82 | Exceptional 7.3% |
| Potawatomi | 99.7 /100 | #83 | Exceptional 7.3% |
Demographics Similar to Latvians by 4 or more Vehicles in Household
In terms of 4 or more vehicles in household, the demographic groups most similar to Latvians are Immigrants from Norway (6.1%, a difference of 0.0%), Egyptian (6.1%, a difference of 0.050%), Immigrants from South Central Asia (6.1%, a difference of 0.060%), Immigrants from Portugal (6.1%, a difference of 0.090%), and Immigrants from Sierra Leone (6.1%, a difference of 0.20%).
| Demographics | Rating | Rank | 4 or more Vehicles in Household |
| Immigrants | Kuwait | 28.0 /100 | #193 | Fair 6.2% |
| Immigrants | Sweden | 27.0 /100 | #194 | Fair 6.2% |
| Argentineans | 27.0 /100 | #195 | Fair 6.2% |
| Tsimshian | 26.4 /100 | #196 | Fair 6.2% |
| Immigrants | Sri Lanka | 23.7 /100 | #197 | Fair 6.1% |
| Immigrants | Portugal | 22.3 /100 | #198 | Fair 6.1% |
| Immigrants | Norway | 21.8 /100 | #199 | Fair 6.1% |
| Latvians | 21.7 /100 | #200 | Fair 6.1% |
| Egyptians | 21.4 /100 | #201 | Fair 6.1% |
| Immigrants | South Central Asia | 21.3 /100 | #202 | Fair 6.1% |
| Immigrants | Sierra Leone | 20.5 /100 | #203 | Fair 6.1% |
| Immigrants | Belize | 19.8 /100 | #204 | Poor 6.1% |
| Hondurans | 19.3 /100 | #205 | Poor 6.1% |
| Kenyans | 18.5 /100 | #206 | Poor 6.1% |
| Immigrants | Chile | 16.9 /100 | #207 | Poor 6.1% |