Paraguayan vs Iranian 4 or more Vehicles in Household
COMPARE
Paraguayan
Iranian
4 or more Vehicles in Household
4 or more Vehicles in Household Comparison
Paraguayans
Iranians
4.9%
4 OR MORE VEHICLES IN HOUSEHOLD
0.0/ 100
METRIC RATING
308th/ 347
METRIC RANK
6.5%
4 OR MORE VEHICLES IN HOUSEHOLD
69.9/ 100
METRIC RATING
156th/ 347
METRIC RANK
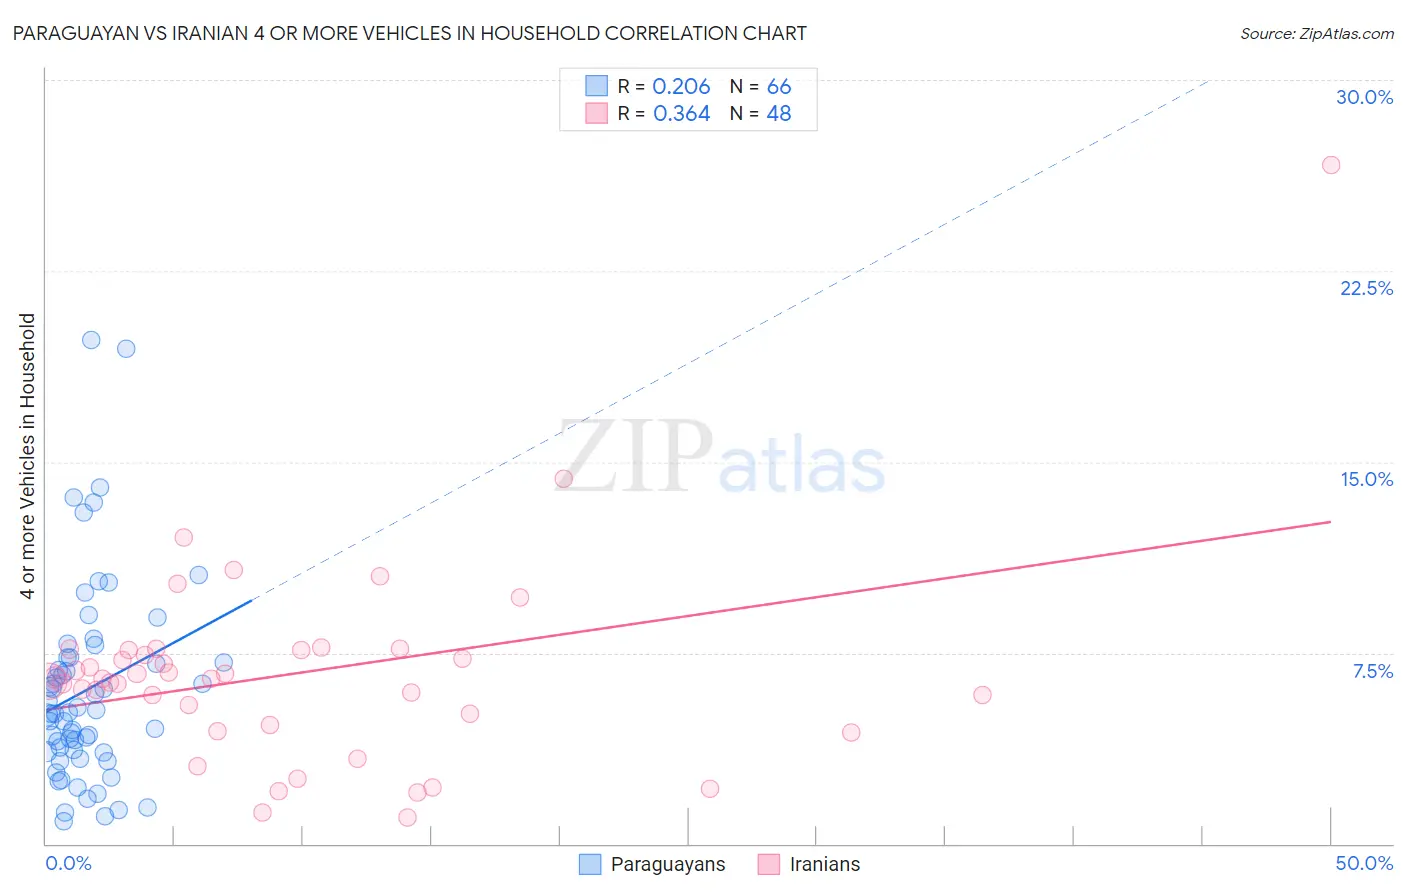
Paraguayan vs Iranian 4 or more Vehicles in Household Correlation Chart
The statistical analysis conducted on geographies consisting of 94,888,057 people shows a weak positive correlation between the proportion of Paraguayans and percentage of households with 4 or more vehicles available in the United States with a correlation coefficient (R) of 0.206 and weighted average of 4.9%. Similarly, the statistical analysis conducted on geographies consisting of 315,200,253 people shows a mild positive correlation between the proportion of Iranians and percentage of households with 4 or more vehicles available in the United States with a correlation coefficient (R) of 0.364 and weighted average of 6.5%, a difference of 30.8%.
4 or more Vehicles in Household Correlation Summary
| Measurement | Paraguayan | Iranian |
| Minimum | 0.86% | 1.1% |
| Maximum | 19.8% | 26.7% |
| Range | 18.9% | 25.6% |
| Mean | 6.1% | 6.7% |
| Median | 5.1% | 6.5% |
| Interquartile 25% (IQ1) | 3.6% | 4.9% |
| Interquartile 75% (IQ3) | 7.3% | 7.6% |
| Interquartile Range (IQR) | 3.7% | 2.7% |
| Standard Deviation (Sample) | 3.9% | 4.0% |
| Standard Deviation (Population) | 3.9% | 4.0% |
Similar Demographics by 4 or more Vehicles in Household
Demographics Similar to Paraguayans by 4 or more Vehicles in Household
In terms of 4 or more vehicles in household, the demographic groups most similar to Paraguayans are Immigrants from Somalia (4.9%, a difference of 0.15%), Moroccan (4.9%, a difference of 0.54%), Houma (4.9%, a difference of 0.54%), Menominee (5.0%, a difference of 0.72%), and Immigrants from Serbia (5.0%, a difference of 1.7%).
| Demographics | Rating | Rank | 4 or more Vehicles in Household |
| Immigrants | Zaire | 0.0 /100 | #301 | Tragic 5.1% |
| Bahamians | 0.0 /100 | #302 | Tragic 5.1% |
| Immigrants | Greece | 0.0 /100 | #303 | Tragic 5.1% |
| Cypriots | 0.0 /100 | #304 | Tragic 5.0% |
| Somalis | 0.0 /100 | #305 | Tragic 5.0% |
| Immigrants | Serbia | 0.0 /100 | #306 | Tragic 5.0% |
| Menominee | 0.0 /100 | #307 | Tragic 5.0% |
| Paraguayans | 0.0 /100 | #308 | Tragic 4.9% |
| Immigrants | Somalia | 0.0 /100 | #309 | Tragic 4.9% |
| Moroccans | 0.0 /100 | #310 | Tragic 4.9% |
| Houma | 0.0 /100 | #311 | Tragic 4.9% |
| Albanians | 0.0 /100 | #312 | Tragic 4.8% |
| Immigrants | Israel | 0.0 /100 | #313 | Tragic 4.8% |
| Immigrants | West Indies | 0.0 /100 | #314 | Tragic 4.7% |
| Immigrants | Belarus | 0.0 /100 | #315 | Tragic 4.7% |
Demographics Similar to Iranians by 4 or more Vehicles in Household
In terms of 4 or more vehicles in household, the demographic groups most similar to Iranians are Peruvian (6.5%, a difference of 0.050%), Iroquois (6.5%, a difference of 0.060%), Central American Indian (6.5%, a difference of 0.14%), Immigrants from Armenia (6.5%, a difference of 0.16%), and Yuman (6.5%, a difference of 0.27%).
| Demographics | Rating | Rank | 4 or more Vehicles in Household |
| Greeks | 73.6 /100 | #149 | Good 6.5% |
| New Zealanders | 73.3 /100 | #150 | Good 6.5% |
| Immigrants | Hong Kong | 72.2 /100 | #151 | Good 6.5% |
| Yuman | 72.1 /100 | #152 | Good 6.5% |
| Immigrants | Armenia | 71.2 /100 | #153 | Good 6.5% |
| Central American Indians | 71.1 /100 | #154 | Good 6.5% |
| Iroquois | 70.4 /100 | #155 | Good 6.5% |
| Iranians | 69.9 /100 | #156 | Good 6.5% |
| Peruvians | 69.4 /100 | #157 | Good 6.5% |
| Zimbabweans | 67.1 /100 | #158 | Good 6.4% |
| Indians (Asian) | 66.3 /100 | #159 | Good 6.4% |
| Palestinians | 65.8 /100 | #160 | Good 6.4% |
| Immigrants | Cameroon | 64.4 /100 | #161 | Good 6.4% |
| Immigrants | Pakistan | 63.2 /100 | #162 | Good 6.4% |
| Chileans | 61.2 /100 | #163 | Good 6.4% |