Ottawa vs Shoshone 4 or more Vehicles in Household
COMPARE
Ottawa
Shoshone
4 or more Vehicles in Household
4 or more Vehicles in Household Comparison
Ottawa
Shoshone
6.6%
4 OR MORE VEHICLES IN HOUSEHOLD
86.9/ 100
METRIC RATING
134th/ 347
METRIC RANK
8.8%
4 OR MORE VEHICLES IN HOUSEHOLD
100.0/ 100
METRIC RATING
15th/ 347
METRIC RANK
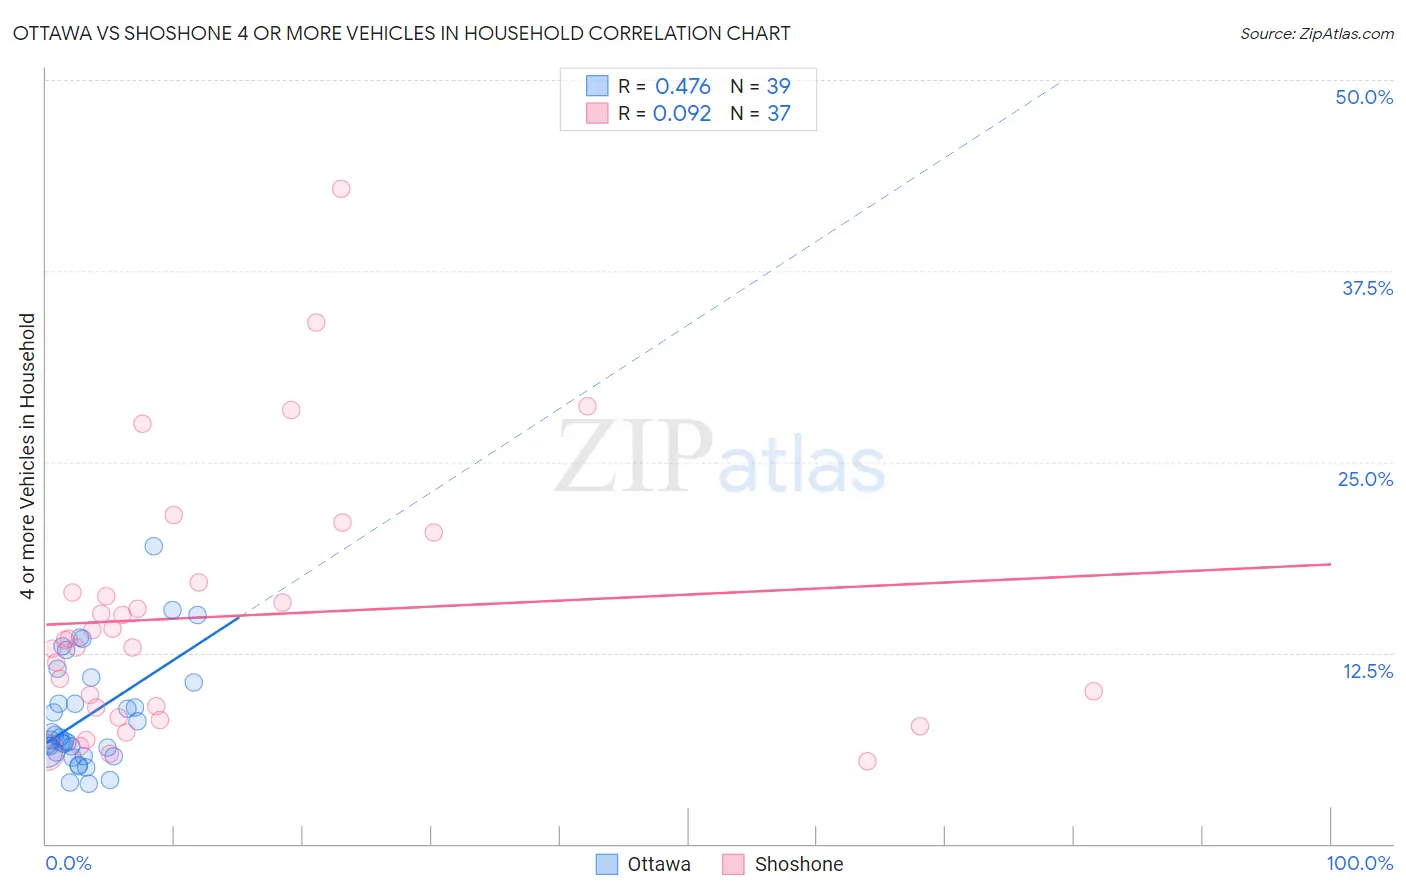
Ottawa vs Shoshone 4 or more Vehicles in Household Correlation Chart
The statistical analysis conducted on geographies consisting of 49,927,174 people shows a moderate positive correlation between the proportion of Ottawa and percentage of households with 4 or more vehicles available in the United States with a correlation coefficient (R) of 0.476 and weighted average of 6.6%. Similarly, the statistical analysis conducted on geographies consisting of 66,577,093 people shows a slight positive correlation between the proportion of Shoshone and percentage of households with 4 or more vehicles available in the United States with a correlation coefficient (R) of 0.092 and weighted average of 8.8%, a difference of 33.5%.
4 or more Vehicles in Household Correlation Summary
| Measurement | Ottawa | Shoshone |
| Minimum | 4.0% | 5.4% |
| Maximum | 19.5% | 42.9% |
| Range | 15.6% | 37.5% |
| Mean | 8.3% | 14.9% |
| Median | 6.8% | 13.3% |
| Interquartile 25% (IQ1) | 6.0% | 8.6% |
| Interquartile 75% (IQ3) | 10.5% | 16.8% |
| Interquartile Range (IQR) | 4.5% | 8.2% |
| Standard Deviation (Sample) | 3.6% | 8.4% |
| Standard Deviation (Population) | 3.5% | 8.3% |
Similar Demographics by 4 or more Vehicles in Household
Demographics Similar to Ottawa by 4 or more Vehicles in Household
In terms of 4 or more vehicles in household, the demographic groups most similar to Ottawa are Armenian (6.6%, a difference of 0.020%), Tohono O'odham (6.6%, a difference of 0.030%), Luxembourger (6.6%, a difference of 0.10%), Immigrants from Netherlands (6.6%, a difference of 0.21%), and French Canadian (6.6%, a difference of 0.30%).
| Demographics | Rating | Rank | 4 or more Vehicles in Household |
| Immigrants | Korea | 93.8 /100 | #127 | Exceptional 6.8% |
| Immigrants | Bolivia | 92.5 /100 | #128 | Exceptional 6.7% |
| Immigrants | England | 92.0 /100 | #129 | Exceptional 6.7% |
| Immigrants | Scotland | 89.0 /100 | #130 | Excellent 6.7% |
| Maltese | 88.4 /100 | #131 | Excellent 6.7% |
| Immigrants | Netherlands | 87.8 /100 | #132 | Excellent 6.6% |
| Armenians | 86.9 /100 | #133 | Excellent 6.6% |
| Ottawa | 86.9 /100 | #134 | Excellent 6.6% |
| Tohono O'odham | 86.7 /100 | #135 | Excellent 6.6% |
| Luxembourgers | 86.4 /100 | #136 | Excellent 6.6% |
| French Canadians | 85.4 /100 | #137 | Excellent 6.6% |
| Italians | 84.5 /100 | #138 | Excellent 6.6% |
| Jordanians | 82.1 /100 | #139 | Excellent 6.6% |
| Slavs | 81.6 /100 | #140 | Excellent 6.6% |
| Australians | 80.8 /100 | #141 | Excellent 6.6% |
Demographics Similar to Shoshone by 4 or more Vehicles in Household
In terms of 4 or more vehicles in household, the demographic groups most similar to Shoshone are Chinese (8.8%, a difference of 0.030%), Lumbee (8.8%, a difference of 0.71%), Hawaiian (8.9%, a difference of 1.0%), Mexican (8.9%, a difference of 1.0%), and Ute (8.8%, a difference of 1.1%).
| Demographics | Rating | Rank | 4 or more Vehicles in Household |
| Arapaho | 100.0 /100 | #8 | Exceptional 9.4% |
| Samoans | 100.0 /100 | #9 | Exceptional 9.2% |
| Paiute | 100.0 /100 | #10 | Exceptional 9.0% |
| Immigrants | Mexico | 100.0 /100 | #11 | Exceptional 9.0% |
| Mexicans | 100.0 /100 | #12 | Exceptional 8.9% |
| Hawaiians | 100.0 /100 | #13 | Exceptional 8.9% |
| Chinese | 100.0 /100 | #14 | Exceptional 8.8% |
| Shoshone | 100.0 /100 | #15 | Exceptional 8.8% |
| Lumbee | 100.0 /100 | #16 | Exceptional 8.8% |
| Ute | 100.0 /100 | #17 | Exceptional 8.8% |
| Nepalese | 100.0 /100 | #18 | Exceptional 8.7% |
| Koreans | 100.0 /100 | #19 | Exceptional 8.6% |
| Pueblo | 100.0 /100 | #20 | Exceptional 8.6% |
| Danes | 100.0 /100 | #21 | Exceptional 8.6% |
| Immigrants | Vietnam | 100.0 /100 | #22 | Exceptional 8.6% |