Nonimmigrants vs Nicaraguan 4 or more Vehicles in Household
COMPARE
Nonimmigrants
Nicaraguan
4 or more Vehicles in Household
4 or more Vehicles in Household Comparison
Nonimmigrants
Nicaraguans
7.2%
4 OR MORE VEHICLES IN HOUSEHOLD
99.6/ 100
METRIC RATING
88th/ 347
METRIC RANK
7.0%
4 OR MORE VEHICLES IN HOUSEHOLD
98.0/ 100
METRIC RATING
107th/ 347
METRIC RANK
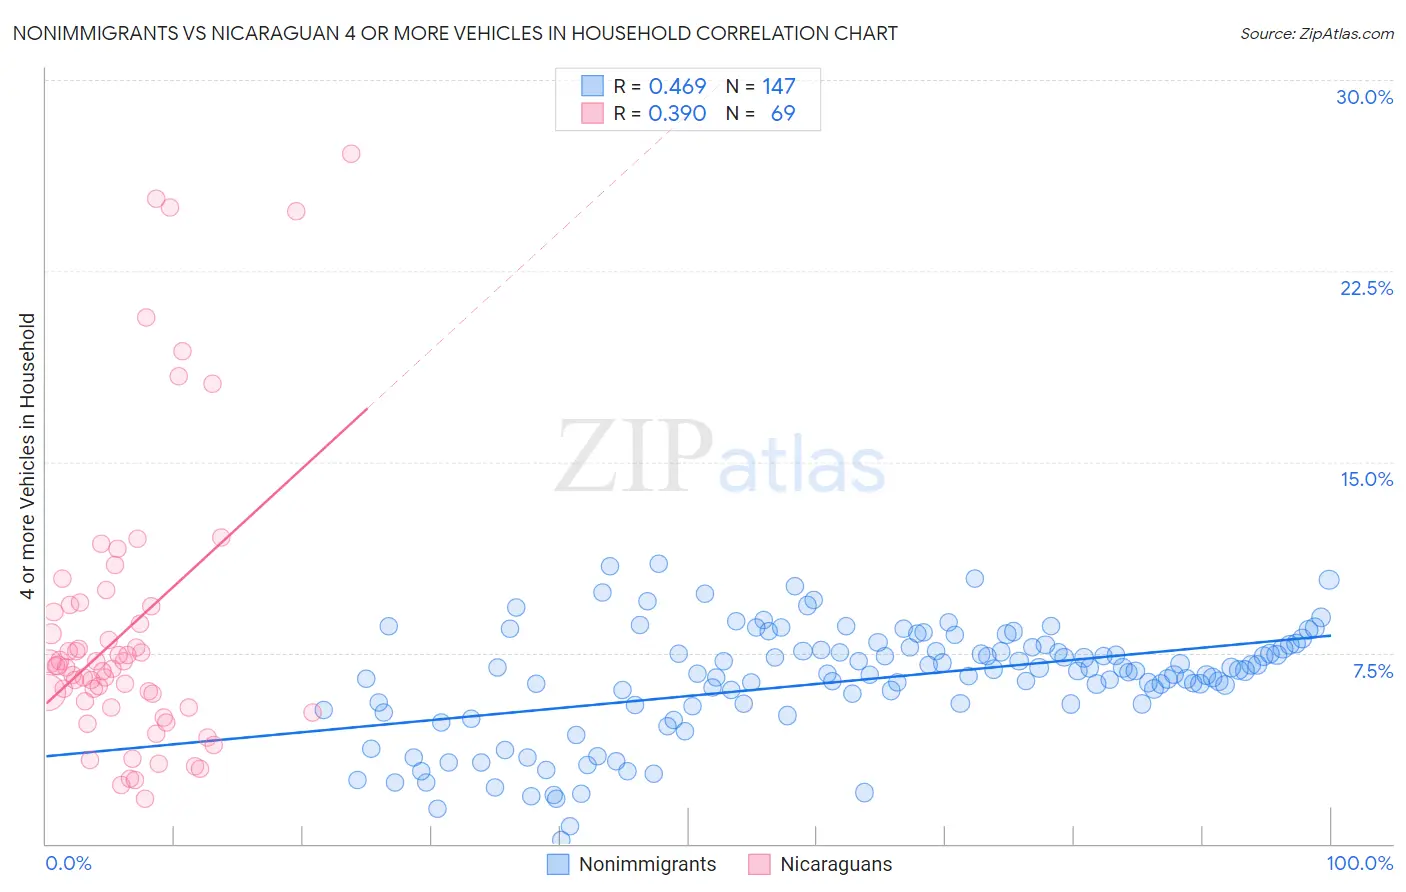
Nonimmigrants vs Nicaraguan 4 or more Vehicles in Household Correlation Chart
The statistical analysis conducted on geographies consisting of 580,369,833 people shows a moderate positive correlation between the proportion of Nonimmigrants and percentage of households with 4 or more vehicles available in the United States with a correlation coefficient (R) of 0.469 and weighted average of 7.2%. Similarly, the statistical analysis conducted on geographies consisting of 284,526,626 people shows a mild positive correlation between the proportion of Nicaraguans and percentage of households with 4 or more vehicles available in the United States with a correlation coefficient (R) of 0.390 and weighted average of 7.0%, a difference of 3.9%.
4 or more Vehicles in Household Correlation Summary
| Measurement | Nonimmigrants | Nicaraguan |
| Minimum | 0.13% | 1.8% |
| Maximum | 11.0% | 27.1% |
| Range | 10.9% | 25.3% |
| Mean | 6.4% | 8.5% |
| Median | 6.8% | 7.0% |
| Interquartile 25% (IQ1) | 5.5% | 5.3% |
| Interquartile 75% (IQ3) | 7.7% | 9.4% |
| Interquartile Range (IQR) | 2.3% | 4.0% |
| Standard Deviation (Sample) | 2.2% | 5.7% |
| Standard Deviation (Population) | 2.2% | 5.7% |
Demographics Similar to Nonimmigrants and Nicaraguans by 4 or more Vehicles in Household
In terms of 4 or more vehicles in household, the demographic groups most similar to Nonimmigrants are Delaware (7.2%, a difference of 0.020%), British (7.2%, a difference of 0.33%), Creek (7.2%, a difference of 0.41%), Assyrian/Chaldean/Syriac (7.2%, a difference of 0.98%), and Immigrants from Latin America (7.1%, a difference of 1.1%). Similarly, the demographic groups most similar to Nicaraguans are Guatemalan (7.0%, a difference of 0.010%), Hmong (7.0%, a difference of 0.36%), German Russian (7.0%, a difference of 0.36%), Blackfeet (7.0%, a difference of 0.84%), and Asian (7.0%, a difference of 0.85%).
| Demographics | Rating | Rank | 4 or more Vehicles in Household |
| Delaware | 99.6 /100 | #87 | Exceptional 7.2% |
| Immigrants | Nonimmigrants | 99.6 /100 | #88 | Exceptional 7.2% |
| British | 99.6 /100 | #89 | Exceptional 7.2% |
| Creek | 99.6 /100 | #90 | Exceptional 7.2% |
| Assyrians/Chaldeans/Syriacs | 99.4 /100 | #91 | Exceptional 7.2% |
| Immigrants | Latin America | 99.4 /100 | #92 | Exceptional 7.1% |
| Immigrants | Afghanistan | 99.3 /100 | #93 | Exceptional 7.1% |
| Dutch West Indians | 99.3 /100 | #94 | Exceptional 7.1% |
| Czechoslovakians | 99.3 /100 | #95 | Exceptional 7.1% |
| Central Americans | 99.3 /100 | #96 | Exceptional 7.1% |
| Celtics | 99.1 /100 | #97 | Exceptional 7.1% |
| Irish | 99.0 /100 | #98 | Exceptional 7.1% |
| Seminole | 98.8 /100 | #99 | Exceptional 7.0% |
| Taiwanese | 98.7 /100 | #100 | Exceptional 7.0% |
| Pakistanis | 98.7 /100 | #101 | Exceptional 7.0% |
| Asians | 98.6 /100 | #102 | Exceptional 7.0% |
| Blackfeet | 98.6 /100 | #103 | Exceptional 7.0% |
| Hmong | 98.3 /100 | #104 | Exceptional 7.0% |
| German Russians | 98.3 /100 | #105 | Exceptional 7.0% |
| Guatemalans | 98.1 /100 | #106 | Exceptional 7.0% |
| Nicaraguans | 98.0 /100 | #107 | Exceptional 7.0% |