Native Hawaiian vs Irish 2 or more Vehicles in Household
COMPARE
Native Hawaiian
Irish
2 or more Vehicles in Household
2 or more Vehicles in Household Comparison
Native Hawaiians
Irish
61.4%
2 OR MORE VEHICLES IN HOUSEHOLD
100.0/ 100
METRIC RATING
16th/ 347
METRIC RANK
60.1%
2 OR MORE VEHICLES IN HOUSEHOLD
100.0/ 100
METRIC RATING
37th/ 347
METRIC RANK
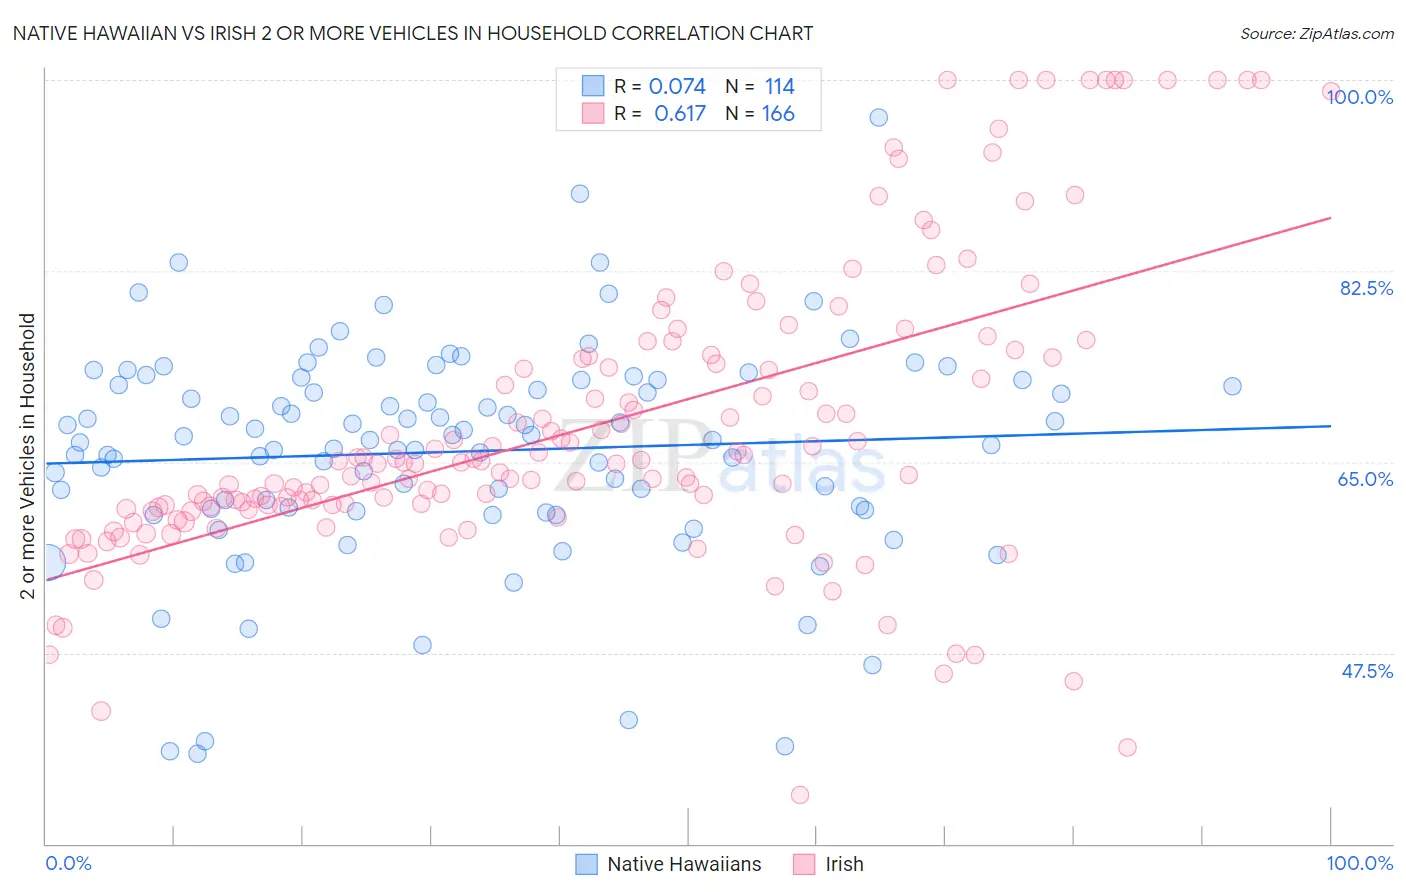
Native Hawaiian vs Irish 2 or more Vehicles in Household Correlation Chart
The statistical analysis conducted on geographies consisting of 331,863,801 people shows a slight positive correlation between the proportion of Native Hawaiians and percentage of households with 2 or more vehicles available in the United States with a correlation coefficient (R) of 0.074 and weighted average of 61.4%. Similarly, the statistical analysis conducted on geographies consisting of 580,068,554 people shows a significant positive correlation between the proportion of Irish and percentage of households with 2 or more vehicles available in the United States with a correlation coefficient (R) of 0.617 and weighted average of 60.1%, a difference of 2.2%.
2 or more Vehicles in Household Correlation Summary
| Measurement | Native Hawaiian | Irish |
| Minimum | 38.2% | 34.5% |
| Maximum | 96.6% | 100.0% |
| Range | 58.3% | 65.5% |
| Mean | 65.9% | 68.2% |
| Median | 67.0% | 64.8% |
| Interquartile 25% (IQ1) | 60.8% | 60.9% |
| Interquartile 75% (IQ3) | 72.5% | 74.6% |
| Interquartile Range (IQR) | 11.7% | 13.7% |
| Standard Deviation (Sample) | 9.9% | 13.6% |
| Standard Deviation (Population) | 9.9% | 13.5% |
Similar Demographics by 2 or more Vehicles in Household
Demographics Similar to Native Hawaiians by 2 or more Vehicles in Household
In terms of 2 or more vehicles in household, the demographic groups most similar to Native Hawaiians are Nepalese (61.4%, a difference of 0.020%), Basque (61.4%, a difference of 0.070%), European (61.4%, a difference of 0.080%), Czech (61.5%, a difference of 0.11%), and Samoan (61.5%, a difference of 0.16%).
| Demographics | Rating | Rank | 2 or more Vehicles in Household |
| Swedes | 100.0 /100 | #9 | Exceptional 61.8% |
| Mexicans | 100.0 /100 | #10 | Exceptional 61.7% |
| Dutch | 100.0 /100 | #11 | Exceptional 61.6% |
| Germans | 100.0 /100 | #12 | Exceptional 61.6% |
| Samoans | 100.0 /100 | #13 | Exceptional 61.5% |
| Czechs | 100.0 /100 | #14 | Exceptional 61.5% |
| Nepalese | 100.0 /100 | #15 | Exceptional 61.4% |
| Native Hawaiians | 100.0 /100 | #16 | Exceptional 61.4% |
| Basques | 100.0 /100 | #17 | Exceptional 61.4% |
| Europeans | 100.0 /100 | #18 | Exceptional 61.4% |
| Scottish | 100.0 /100 | #19 | Exceptional 61.2% |
| Sri Lankans | 100.0 /100 | #20 | Exceptional 61.0% |
| Koreans | 100.0 /100 | #21 | Exceptional 61.0% |
| Swiss | 100.0 /100 | #22 | Exceptional 61.0% |
| Scotch-Irish | 100.0 /100 | #23 | Exceptional 60.9% |
Demographics Similar to Irish by 2 or more Vehicles in Household
In terms of 2 or more vehicles in household, the demographic groups most similar to Irish are Chinese (60.1%, a difference of 0.030%), Immigrants from Philippines (60.1%, a difference of 0.060%), American (60.0%, a difference of 0.060%), British (60.0%, a difference of 0.070%), and Spanish (60.2%, a difference of 0.18%).
| Demographics | Rating | Rank | 2 or more Vehicles in Household |
| Finns | 100.0 /100 | #30 | Exceptional 60.3% |
| Spanish American Indians | 100.0 /100 | #31 | Exceptional 60.3% |
| Arapaho | 100.0 /100 | #32 | Exceptional 60.2% |
| Immigrants | Mexico | 100.0 /100 | #33 | Exceptional 60.2% |
| Spanish | 100.0 /100 | #34 | Exceptional 60.2% |
| Immigrants | Philippines | 100.0 /100 | #35 | Exceptional 60.1% |
| Chinese | 100.0 /100 | #36 | Exceptional 60.1% |
| Irish | 100.0 /100 | #37 | Exceptional 60.1% |
| Americans | 100.0 /100 | #38 | Exceptional 60.0% |
| British | 100.0 /100 | #39 | Exceptional 60.0% |
| Cherokee | 100.0 /100 | #40 | Exceptional 59.9% |
| Northern Europeans | 100.0 /100 | #41 | Exceptional 59.9% |
| Malaysians | 100.0 /100 | #42 | Exceptional 59.8% |
| Czechoslovakians | 100.0 /100 | #43 | Exceptional 59.8% |
| French | 100.0 /100 | #44 | Exceptional 59.8% |