Moroccan vs Slovene 1 or more Vehicles in Household
COMPARE
Moroccan
Slovene
1 or more Vehicles in Household
1 or more Vehicles in Household Comparison
Moroccans
Slovenes
85.4%
1 OR MORE VEHICLES IN HOUSEHOLD
0.0/ 100
METRIC RATING
302nd/ 347
METRIC RANK
92.0%
1 OR MORE VEHICLES IN HOUSEHOLD
99.9/ 100
METRIC RATING
54th/ 347
METRIC RANK
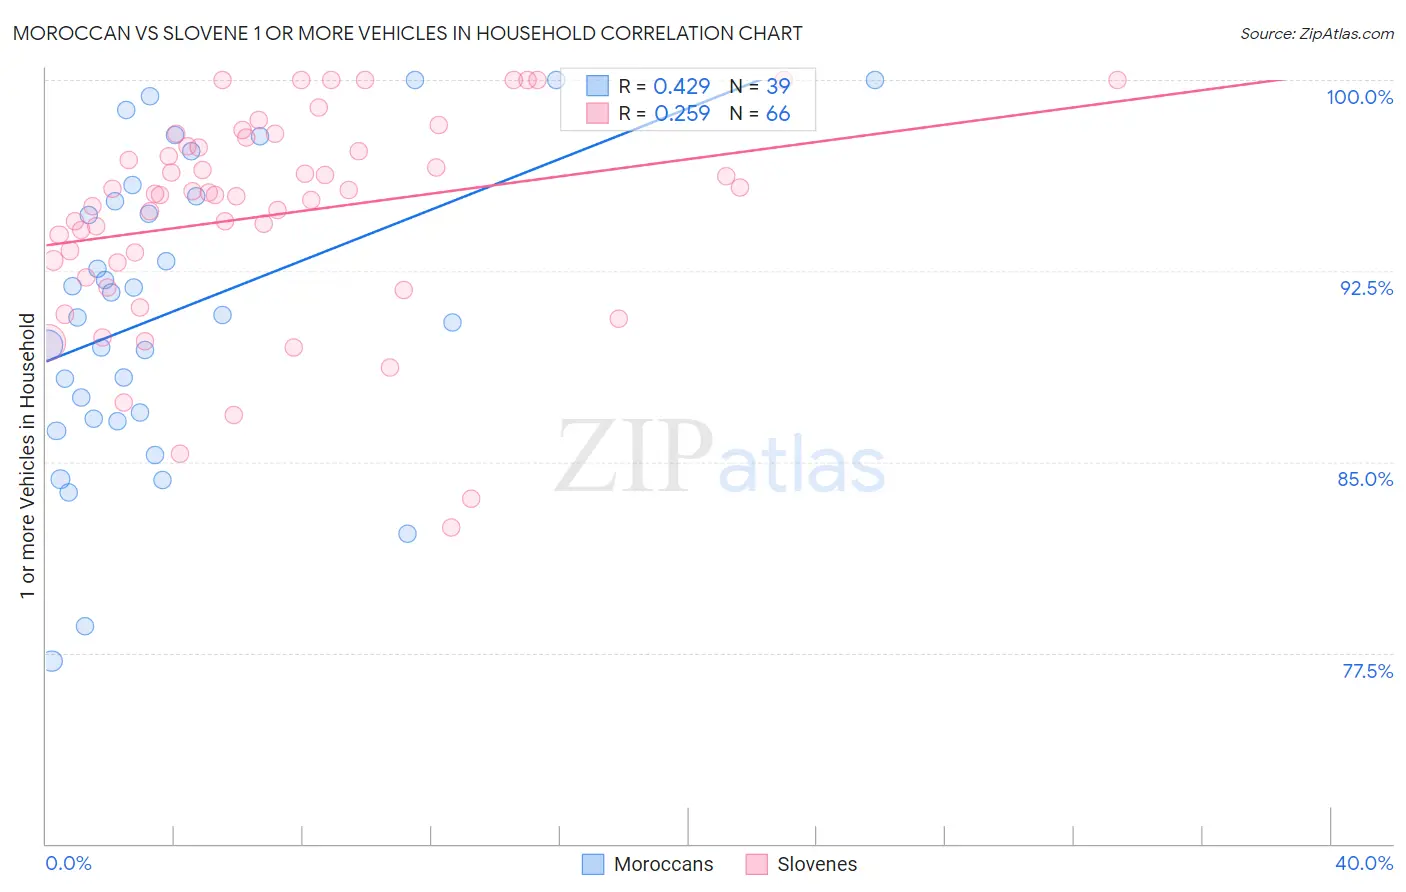
Moroccan vs Slovene 1 or more Vehicles in Household Correlation Chart
The statistical analysis conducted on geographies consisting of 201,766,092 people shows a moderate positive correlation between the proportion of Moroccans and percentage of households with 1 or more vehicles available in the United States with a correlation coefficient (R) of 0.429 and weighted average of 85.4%. Similarly, the statistical analysis conducted on geographies consisting of 261,275,644 people shows a weak positive correlation between the proportion of Slovenes and percentage of households with 1 or more vehicles available in the United States with a correlation coefficient (R) of 0.259 and weighted average of 92.0%, a difference of 7.8%.
1 or more Vehicles in Household Correlation Summary
| Measurement | Moroccan | Slovene |
| Minimum | 77.2% | 82.4% |
| Maximum | 100.0% | 100.0% |
| Range | 22.8% | 17.6% |
| Mean | 90.9% | 94.7% |
| Median | 90.8% | 95.5% |
| Interquartile 25% (IQ1) | 86.7% | 92.8% |
| Interquartile 75% (IQ3) | 95.5% | 97.4% |
| Interquartile Range (IQR) | 8.7% | 4.5% |
| Standard Deviation (Sample) | 5.9% | 4.1% |
| Standard Deviation (Population) | 5.8% | 4.1% |
Similar Demographics by 1 or more Vehicles in Household
Demographics Similar to Moroccans by 1 or more Vehicles in Household
In terms of 1 or more vehicles in household, the demographic groups most similar to Moroccans are Immigrants from Panama (85.4%, a difference of 0.020%), Immigrants from Greece (85.4%, a difference of 0.030%), Immigrants from Russia (85.4%, a difference of 0.060%), Yuman (85.5%, a difference of 0.070%), and Immigrants from Ukraine (85.2%, a difference of 0.20%).
| Demographics | Rating | Rank | 1 or more Vehicles in Household |
| Immigrants | Jamaica | 0.0 /100 | #295 | Tragic 85.8% |
| Immigrants | Spain | 0.0 /100 | #296 | Tragic 85.8% |
| Paraguayans | 0.0 /100 | #297 | Tragic 85.7% |
| Belizeans | 0.0 /100 | #298 | Tragic 85.7% |
| Yuman | 0.0 /100 | #299 | Tragic 85.5% |
| Immigrants | Russia | 0.0 /100 | #300 | Tragic 85.4% |
| Immigrants | Panama | 0.0 /100 | #301 | Tragic 85.4% |
| Moroccans | 0.0 /100 | #302 | Tragic 85.4% |
| Immigrants | Greece | 0.0 /100 | #303 | Tragic 85.4% |
| Immigrants | Ukraine | 0.0 /100 | #304 | Tragic 85.2% |
| Immigrants | China | 0.0 /100 | #305 | Tragic 84.9% |
| Immigrants | Western Africa | 0.0 /100 | #306 | Tragic 84.9% |
| Tohono O'odham | 0.0 /100 | #307 | Tragic 84.7% |
| Immigrants | Belize | 0.0 /100 | #308 | Tragic 84.7% |
| Immigrants | Haiti | 0.0 /100 | #309 | Tragic 84.7% |
Demographics Similar to Slovenes by 1 or more Vehicles in Household
In terms of 1 or more vehicles in household, the demographic groups most similar to Slovenes are Hawaiian (92.0%, a difference of 0.010%), Korean (92.1%, a difference of 0.040%), Celtic (92.1%, a difference of 0.060%), Immigrants from Afghanistan (92.0%, a difference of 0.060%), and Immigrants from Venezuela (92.0%, a difference of 0.060%).
| Demographics | Rating | Rank | 1 or more Vehicles in Household |
| Northern Europeans | 99.9 /100 | #47 | Exceptional 92.2% |
| Belgians | 99.9 /100 | #48 | Exceptional 92.1% |
| Afghans | 99.9 /100 | #49 | Exceptional 92.1% |
| Guamanians/Chamorros | 99.9 /100 | #50 | Exceptional 92.1% |
| Celtics | 99.9 /100 | #51 | Exceptional 92.1% |
| Koreans | 99.9 /100 | #52 | Exceptional 92.1% |
| Hawaiians | 99.9 /100 | #53 | Exceptional 92.0% |
| Slovenes | 99.9 /100 | #54 | Exceptional 92.0% |
| Immigrants | Afghanistan | 99.9 /100 | #55 | Exceptional 92.0% |
| Immigrants | Venezuela | 99.9 /100 | #56 | Exceptional 92.0% |
| Iraqis | 99.8 /100 | #57 | Exceptional 91.9% |
| Immigrants | Mexico | 99.8 /100 | #58 | Exceptional 91.9% |
| Venezuelans | 99.8 /100 | #59 | Exceptional 91.9% |
| Slovaks | 99.8 /100 | #60 | Exceptional 91.9% |
| Immigrants | India | 99.8 /100 | #61 | Exceptional 91.9% |