Israeli vs Immigrants from Lithuania 1 or more Vehicles in Household
COMPARE
Israeli
Immigrants from Lithuania
1 or more Vehicles in Household
1 or more Vehicles in Household Comparison
Israelis
Immigrants from Lithuania
87.7%
1 OR MORE VEHICLES IN HOUSEHOLD
0.3/ 100
METRIC RATING
266th/ 347
METRIC RANK
90.2%
1 OR MORE VEHICLES IN HOUSEHOLD
83.0/ 100
METRIC RATING
142nd/ 347
METRIC RANK
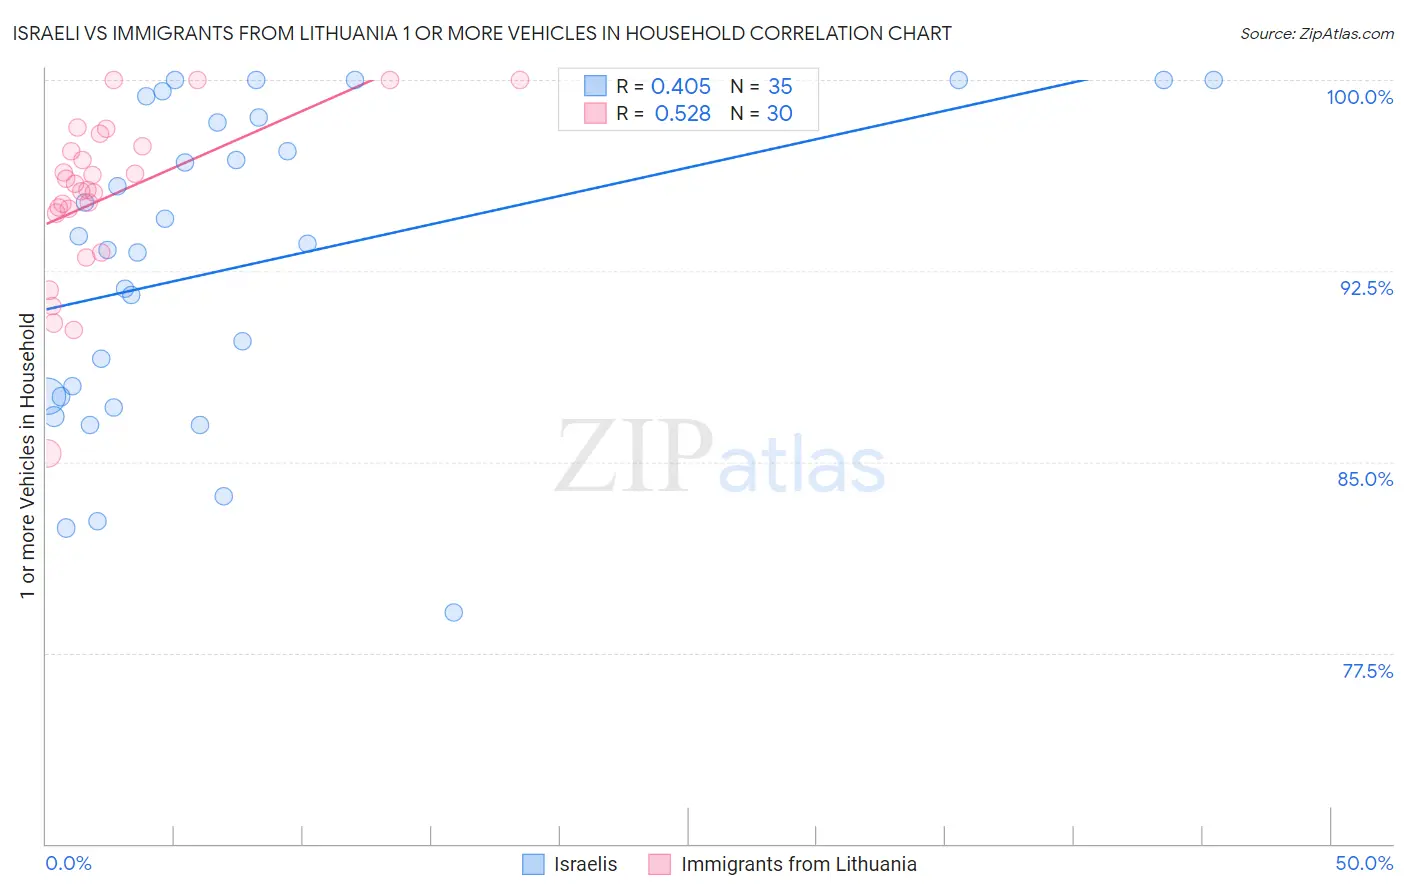
Israeli vs Immigrants from Lithuania 1 or more Vehicles in Household Correlation Chart
The statistical analysis conducted on geographies consisting of 211,015,607 people shows a moderate positive correlation between the proportion of Israelis and percentage of households with 1 or more vehicles available in the United States with a correlation coefficient (R) of 0.405 and weighted average of 87.7%. Similarly, the statistical analysis conducted on geographies consisting of 117,713,976 people shows a substantial positive correlation between the proportion of Immigrants from Lithuania and percentage of households with 1 or more vehicles available in the United States with a correlation coefficient (R) of 0.528 and weighted average of 90.2%, a difference of 2.9%.
1 or more Vehicles in Household Correlation Summary
| Measurement | Israeli | Immigrants from Lithuania |
| Minimum | 79.1% | 85.3% |
| Maximum | 100.0% | 100.0% |
| Range | 20.9% | 14.7% |
| Mean | 92.7% | 95.4% |
| Median | 93.5% | 95.8% |
| Interquartile 25% (IQ1) | 87.6% | 94.8% |
| Interquartile 75% (IQ3) | 98.5% | 97.4% |
| Interquartile Range (IQR) | 11.0% | 2.6% |
| Standard Deviation (Sample) | 6.1% | 3.3% |
| Standard Deviation (Population) | 6.0% | 3.2% |
Similar Demographics by 1 or more Vehicles in Household
Demographics Similar to Israelis by 1 or more Vehicles in Household
In terms of 1 or more vehicles in household, the demographic groups most similar to Israelis are Immigrants from Colombia (87.6%, a difference of 0.030%), Immigrants from Europe (87.6%, a difference of 0.070%), Immigrants from Africa (87.6%, a difference of 0.12%), Panamanian (87.5%, a difference of 0.13%), and Bermudan (87.5%, a difference of 0.13%).
| Demographics | Rating | Rank | 1 or more Vehicles in Household |
| Nigerians | 0.8 /100 | #259 | Tragic 88.0% |
| Macedonians | 0.6 /100 | #260 | Tragic 87.9% |
| Immigrants | Switzerland | 0.6 /100 | #261 | Tragic 87.9% |
| Sub-Saharan Africans | 0.5 /100 | #262 | Tragic 87.9% |
| Immigrants | Egypt | 0.5 /100 | #263 | Tragic 87.8% |
| Immigrants | Liberia | 0.4 /100 | #264 | Tragic 87.8% |
| Africans | 0.4 /100 | #265 | Tragic 87.8% |
| Israelis | 0.3 /100 | #266 | Tragic 87.7% |
| Immigrants | Colombia | 0.3 /100 | #267 | Tragic 87.6% |
| Immigrants | Europe | 0.2 /100 | #268 | Tragic 87.6% |
| Immigrants | Africa | 0.2 /100 | #269 | Tragic 87.6% |
| Panamanians | 0.2 /100 | #270 | Tragic 87.5% |
| Bermudans | 0.2 /100 | #271 | Tragic 87.5% |
| Aleuts | 0.2 /100 | #272 | Tragic 87.5% |
| Immigrants | Northern Africa | 0.2 /100 | #273 | Tragic 87.4% |
Demographics Similar to Immigrants from Lithuania by 1 or more Vehicles in Household
In terms of 1 or more vehicles in household, the demographic groups most similar to Immigrants from Lithuania are Immigrants from Moldova (90.2%, a difference of 0.0%), Immigrants from Bahamas (90.2%, a difference of 0.040%), Immigrants from Zimbabwe (90.2%, a difference of 0.040%), Sioux (90.2%, a difference of 0.040%), and Sudanese (90.3%, a difference of 0.060%).
| Demographics | Rating | Rank | 1 or more Vehicles in Household |
| Immigrants | Oceania | 86.9 /100 | #135 | Excellent 90.4% |
| Hungarians | 86.5 /100 | #136 | Excellent 90.3% |
| Latvians | 86.3 /100 | #137 | Excellent 90.3% |
| Syrians | 86.3 /100 | #138 | Excellent 90.3% |
| Estonians | 85.6 /100 | #139 | Excellent 90.3% |
| Sudanese | 85.2 /100 | #140 | Excellent 90.3% |
| Immigrants | Moldova | 83.1 /100 | #141 | Excellent 90.2% |
| Immigrants | Lithuania | 83.0 /100 | #142 | Excellent 90.2% |
| Immigrants | Bahamas | 81.5 /100 | #143 | Excellent 90.2% |
| Immigrants | Zimbabwe | 81.5 /100 | #144 | Excellent 90.2% |
| Sioux | 81.3 /100 | #145 | Excellent 90.2% |
| Bahamians | 80.5 /100 | #146 | Excellent 90.2% |
| Chileans | 79.8 /100 | #147 | Good 90.2% |
| Immigrants | Eastern Africa | 78.2 /100 | #148 | Good 90.1% |
| Immigrants | Nicaragua | 76.7 /100 | #149 | Good 90.1% |