Mongolian vs German No Vehicles in Household
COMPARE
Mongolian
German
No Vehicles in Household
No Vehicles in Household Comparison
Mongolians
Germans
13.1%
NO VEHICLES IN HOUSEHOLD
0.0/ 100
METRIC RATING
279th/ 347
METRIC RANK
6.7%
NO VEHICLES IN HOUSEHOLD
100.0/ 100
METRIC RATING
6th/ 347
METRIC RANK
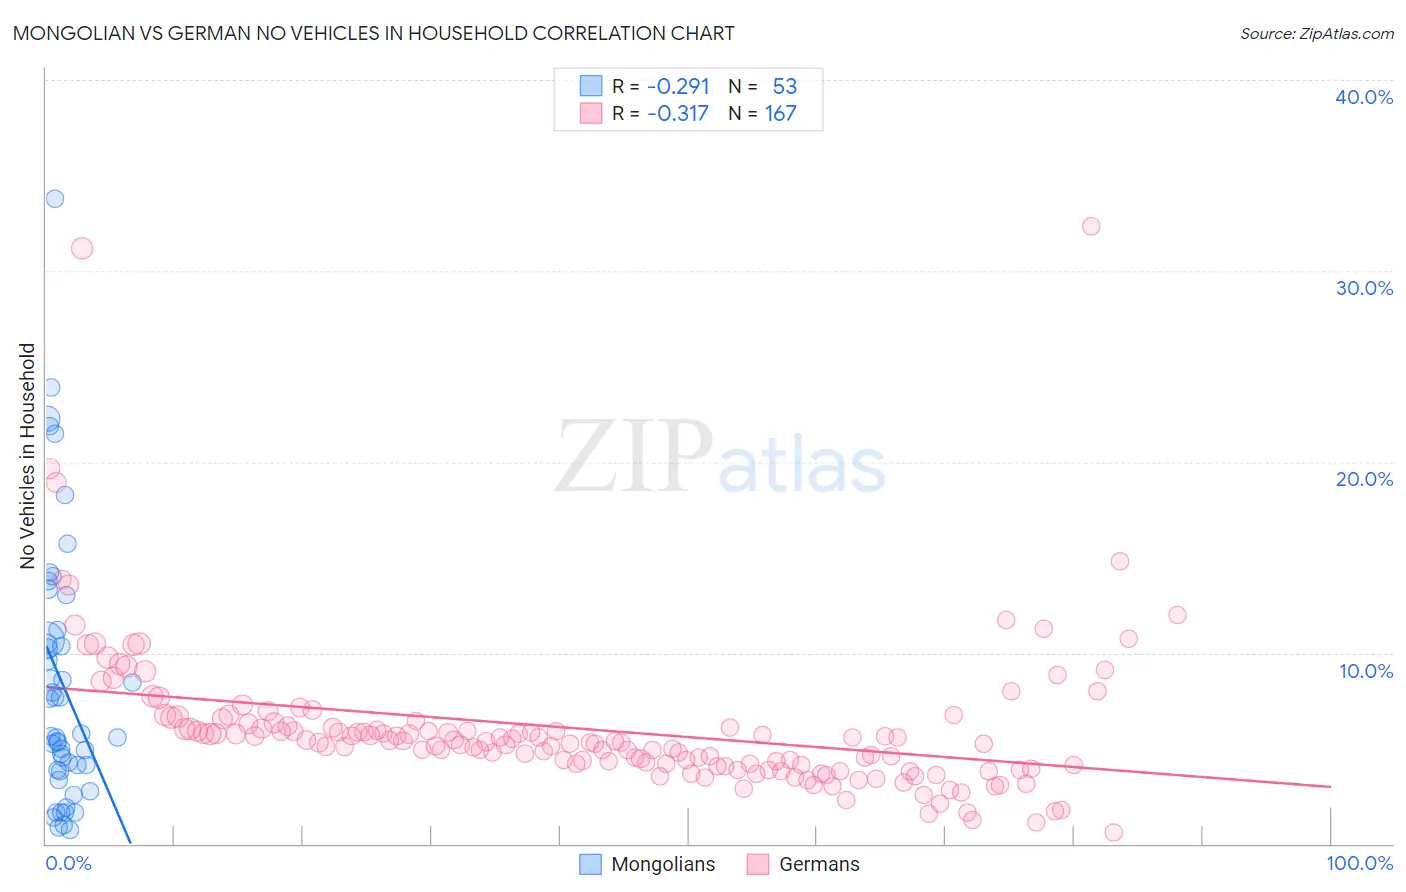
Mongolian vs German No Vehicles in Household Correlation Chart
The statistical analysis conducted on geographies consisting of 140,111,412 people shows a weak negative correlation between the proportion of Mongolians and percentage of households with no vehicle available in the United States with a correlation coefficient (R) of -0.291 and weighted average of 13.1%. Similarly, the statistical analysis conducted on geographies consisting of 573,819,115 people shows a mild negative correlation between the proportion of Germans and percentage of households with no vehicle available in the United States with a correlation coefficient (R) of -0.317 and weighted average of 6.7%, a difference of 96.6%.
No Vehicles in Household Correlation Summary
| Measurement | Mongolian | German |
| Minimum | 0.73% | 0.56% |
| Maximum | 33.8% | 32.3% |
| Range | 33.1% | 31.8% |
| Mean | 8.4% | 6.0% |
| Median | 5.6% | 5.3% |
| Interquartile 25% (IQ1) | 3.8% | 4.1% |
| Interquartile 75% (IQ3) | 11.0% | 6.1% |
| Interquartile Range (IQR) | 7.1% | 2.0% |
| Standard Deviation (Sample) | 6.9% | 4.0% |
| Standard Deviation (Population) | 6.9% | 4.0% |
Similar Demographics by No Vehicles in Household
Demographics Similar to Mongolians by No Vehicles in Household
In terms of no vehicles in household, the demographic groups most similar to Mongolians are Alsatian (13.2%, a difference of 0.27%), Immigrants from Croatia (13.0%, a difference of 0.69%), Aleut (13.0%, a difference of 0.73%), Immigrants from Southern Europe (13.0%, a difference of 0.81%), and Immigrants from Albania (13.0%, a difference of 1.2%).
| Demographics | Rating | Rank | No Vehicles in Household |
| Bermudans | 0.1 /100 | #272 | Tragic 12.8% |
| Immigrants | France | 0.1 /100 | #273 | Tragic 12.9% |
| Immigrants | Singapore | 0.1 /100 | #274 | Tragic 12.9% |
| Immigrants | Albania | 0.1 /100 | #275 | Tragic 13.0% |
| Immigrants | Southern Europe | 0.1 /100 | #276 | Tragic 13.0% |
| Aleuts | 0.1 /100 | #277 | Tragic 13.0% |
| Immigrants | Croatia | 0.1 /100 | #278 | Tragic 13.0% |
| Mongolians | 0.0 /100 | #279 | Tragic 13.1% |
| Alsatians | 0.0 /100 | #280 | Tragic 13.2% |
| Central American Indians | 0.0 /100 | #281 | Tragic 13.3% |
| Immigrants | Eastern Asia | 0.0 /100 | #282 | Tragic 13.5% |
| Immigrants | Kazakhstan | 0.0 /100 | #283 | Tragic 13.6% |
| Immigrants | Malaysia | 0.0 /100 | #284 | Tragic 13.6% |
| Immigrants | Eastern Europe | 0.0 /100 | #285 | Tragic 13.6% |
| Colville | 0.0 /100 | #286 | Tragic 13.7% |
Demographics Similar to Germans by No Vehicles in Household
In terms of no vehicles in household, the demographic groups most similar to Germans are Yakama (6.6%, a difference of 0.99%), Scottish (6.8%, a difference of 1.3%), Danish (6.6%, a difference of 1.3%), Swedish (6.8%, a difference of 1.8%), and Scotch-Irish (6.8%, a difference of 2.0%).
| Demographics | Rating | Rank | No Vehicles in Household |
| Luxembourgers | 100.0 /100 | #1 | Exceptional 5.4% |
| Norwegians | 100.0 /100 | #2 | Exceptional 6.4% |
| English | 100.0 /100 | #3 | Exceptional 6.5% |
| Danes | 100.0 /100 | #4 | Exceptional 6.6% |
| Yakama | 100.0 /100 | #5 | Exceptional 6.6% |
| Germans | 100.0 /100 | #6 | Exceptional 6.7% |
| Scottish | 100.0 /100 | #7 | Exceptional 6.8% |
| Swedes | 100.0 /100 | #8 | Exceptional 6.8% |
| Scotch-Irish | 100.0 /100 | #9 | Exceptional 6.8% |
| Dutch | 100.0 /100 | #10 | Exceptional 6.8% |
| Czechs | 100.0 /100 | #11 | Exceptional 6.9% |
| Assyrians/Chaldeans/Syriacs | 100.0 /100 | #12 | Exceptional 7.0% |
| Scandinavians | 100.0 /100 | #13 | Exceptional 7.0% |
| Mexicans | 100.0 /100 | #14 | Exceptional 7.0% |
| Whites/Caucasians | 100.0 /100 | #15 | Exceptional 7.0% |