Maltese vs South American 4 or more Vehicles in Household
COMPARE
Maltese
South American
4 or more Vehicles in Household
4 or more Vehicles in Household Comparison
Maltese
South Americans
6.7%
4 OR MORE VEHICLES IN HOUSEHOLD
88.4/ 100
METRIC RATING
131st/ 347
METRIC RANK
5.6%
4 OR MORE VEHICLES IN HOUSEHOLD
0.9/ 100
METRIC RATING
265th/ 347
METRIC RANK
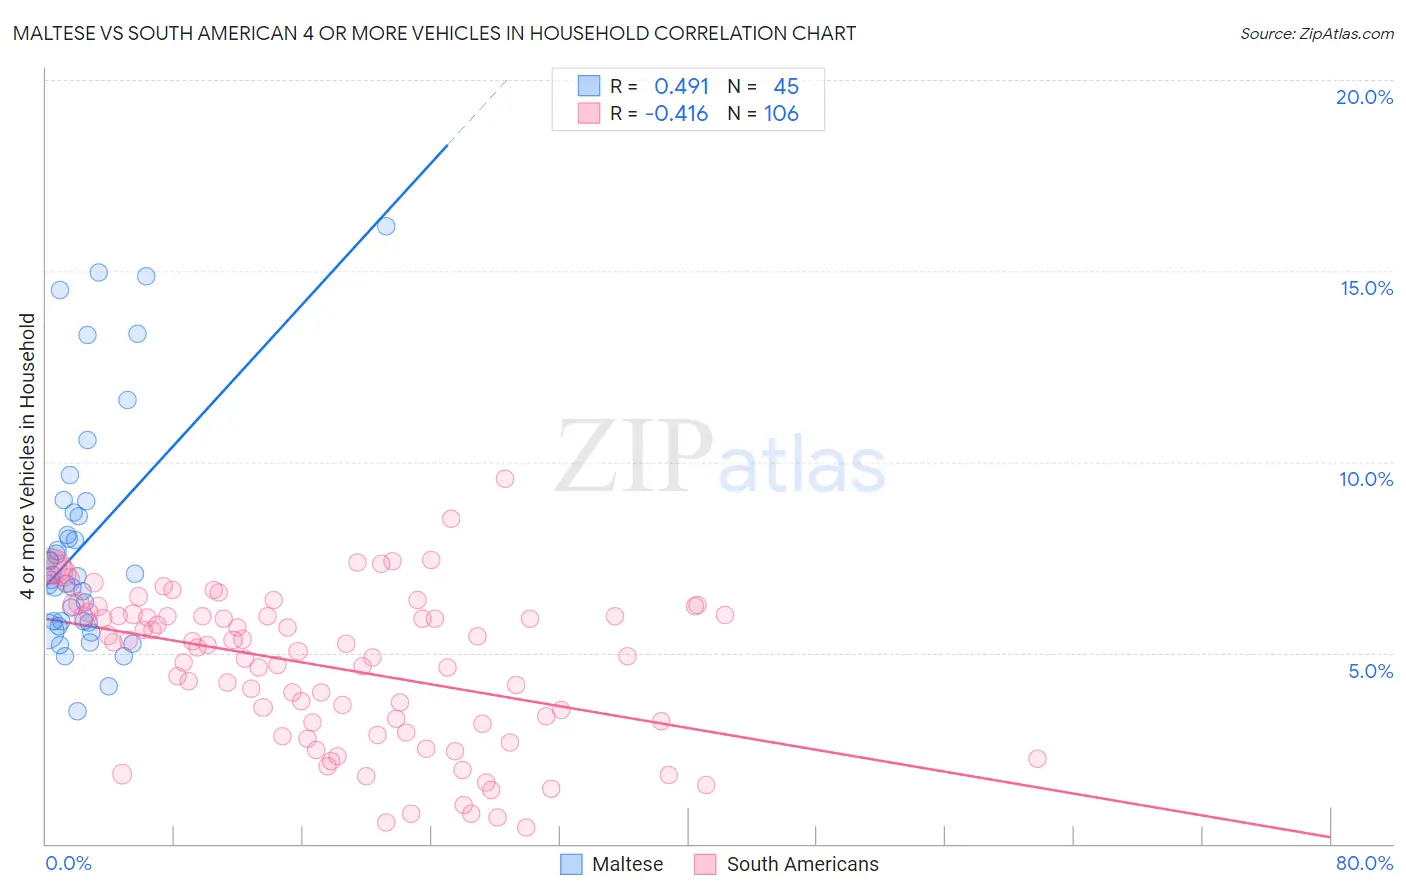
Maltese vs South American 4 or more Vehicles in Household Correlation Chart
The statistical analysis conducted on geographies consisting of 125,931,665 people shows a moderate positive correlation between the proportion of Maltese and percentage of households with 4 or more vehicles available in the United States with a correlation coefficient (R) of 0.491 and weighted average of 6.7%. Similarly, the statistical analysis conducted on geographies consisting of 491,409,922 people shows a moderate negative correlation between the proportion of South Americans and percentage of households with 4 or more vehicles available in the United States with a correlation coefficient (R) of -0.416 and weighted average of 5.6%, a difference of 19.4%.
4 or more Vehicles in Household Correlation Summary
| Measurement | Maltese | South American |
| Minimum | 3.5% | 0.44% |
| Maximum | 16.2% | 9.6% |
| Range | 12.7% | 9.1% |
| Mean | 7.9% | 4.6% |
| Median | 7.0% | 5.2% |
| Interquartile 25% (IQ1) | 5.8% | 3.2% |
| Interquartile 75% (IQ3) | 8.8% | 6.0% |
| Interquartile Range (IQR) | 3.0% | 2.8% |
| Standard Deviation (Sample) | 3.1% | 2.0% |
| Standard Deviation (Population) | 3.1% | 2.0% |
Similar Demographics by 4 or more Vehicles in Household
Demographics Similar to Maltese by 4 or more Vehicles in Household
In terms of 4 or more vehicles in household, the demographic groups most similar to Maltese are Immigrants from Netherlands (6.6%, a difference of 0.14%), Immigrants from Scotland (6.7%, a difference of 0.15%), Armenian (6.6%, a difference of 0.34%), Ottawa (6.6%, a difference of 0.35%), and Tohono O'odham (6.6%, a difference of 0.38%).
| Demographics | Rating | Rank | 4 or more Vehicles in Household |
| Immigrants | Asia | 94.4 /100 | #124 | Exceptional 6.8% |
| Austrians | 94.1 /100 | #125 | Exceptional 6.8% |
| Belgians | 94.1 /100 | #126 | Exceptional 6.8% |
| Immigrants | Korea | 93.8 /100 | #127 | Exceptional 6.8% |
| Immigrants | Bolivia | 92.5 /100 | #128 | Exceptional 6.7% |
| Immigrants | England | 92.0 /100 | #129 | Exceptional 6.7% |
| Immigrants | Scotland | 89.0 /100 | #130 | Excellent 6.7% |
| Maltese | 88.4 /100 | #131 | Excellent 6.7% |
| Immigrants | Netherlands | 87.8 /100 | #132 | Excellent 6.6% |
| Armenians | 86.9 /100 | #133 | Excellent 6.6% |
| Ottawa | 86.9 /100 | #134 | Excellent 6.6% |
| Tohono O'odham | 86.7 /100 | #135 | Excellent 6.6% |
| Luxembourgers | 86.4 /100 | #136 | Excellent 6.6% |
| French Canadians | 85.4 /100 | #137 | Excellent 6.6% |
| Italians | 84.5 /100 | #138 | Excellent 6.6% |
Demographics Similar to South Americans by 4 or more Vehicles in Household
In terms of 4 or more vehicles in household, the demographic groups most similar to South Americans are Immigrants from Nepal (5.6%, a difference of 0.020%), Immigrants from Ukraine (5.6%, a difference of 0.11%), Immigrants from Africa (5.6%, a difference of 0.22%), Colombian (5.5%, a difference of 0.54%), and Carpatho Rusyn (5.5%, a difference of 0.69%).
| Demographics | Rating | Rank | 4 or more Vehicles in Household |
| Immigrants | Lithuania | 1.4 /100 | #258 | Tragic 5.6% |
| Immigrants | France | 1.3 /100 | #259 | Tragic 5.6% |
| Uruguayans | 1.3 /100 | #260 | Tragic 5.6% |
| Sudanese | 1.2 /100 | #261 | Tragic 5.6% |
| Bermudans | 1.2 /100 | #262 | Tragic 5.6% |
| Immigrants | Saudi Arabia | 1.1 /100 | #263 | Tragic 5.6% |
| Immigrants | Africa | 1.0 /100 | #264 | Tragic 5.6% |
| South Americans | 0.9 /100 | #265 | Tragic 5.6% |
| Immigrants | Nepal | 0.9 /100 | #266 | Tragic 5.6% |
| Immigrants | Ukraine | 0.9 /100 | #267 | Tragic 5.6% |
| Colombians | 0.7 /100 | #268 | Tragic 5.5% |
| Carpatho Rusyns | 0.7 /100 | #269 | Tragic 5.5% |
| Okinawans | 0.6 /100 | #270 | Tragic 5.5% |
| Immigrants | Sudan | 0.6 /100 | #271 | Tragic 5.5% |
| Immigrants | Kazakhstan | 0.6 /100 | #272 | Tragic 5.5% |