Maltese vs Immigrants from Western Europe 4 or more Vehicles in Household
COMPARE
Maltese
Immigrants from Western Europe
4 or more Vehicles in Household
4 or more Vehicles in Household Comparison
Maltese
Immigrants from Western Europe
6.7%
4 OR MORE VEHICLES IN HOUSEHOLD
88.4/ 100
METRIC RATING
131st/ 347
METRIC RANK
6.3%
4 OR MORE VEHICLES IN HOUSEHOLD
48.8/ 100
METRIC RATING
175th/ 347
METRIC RANK
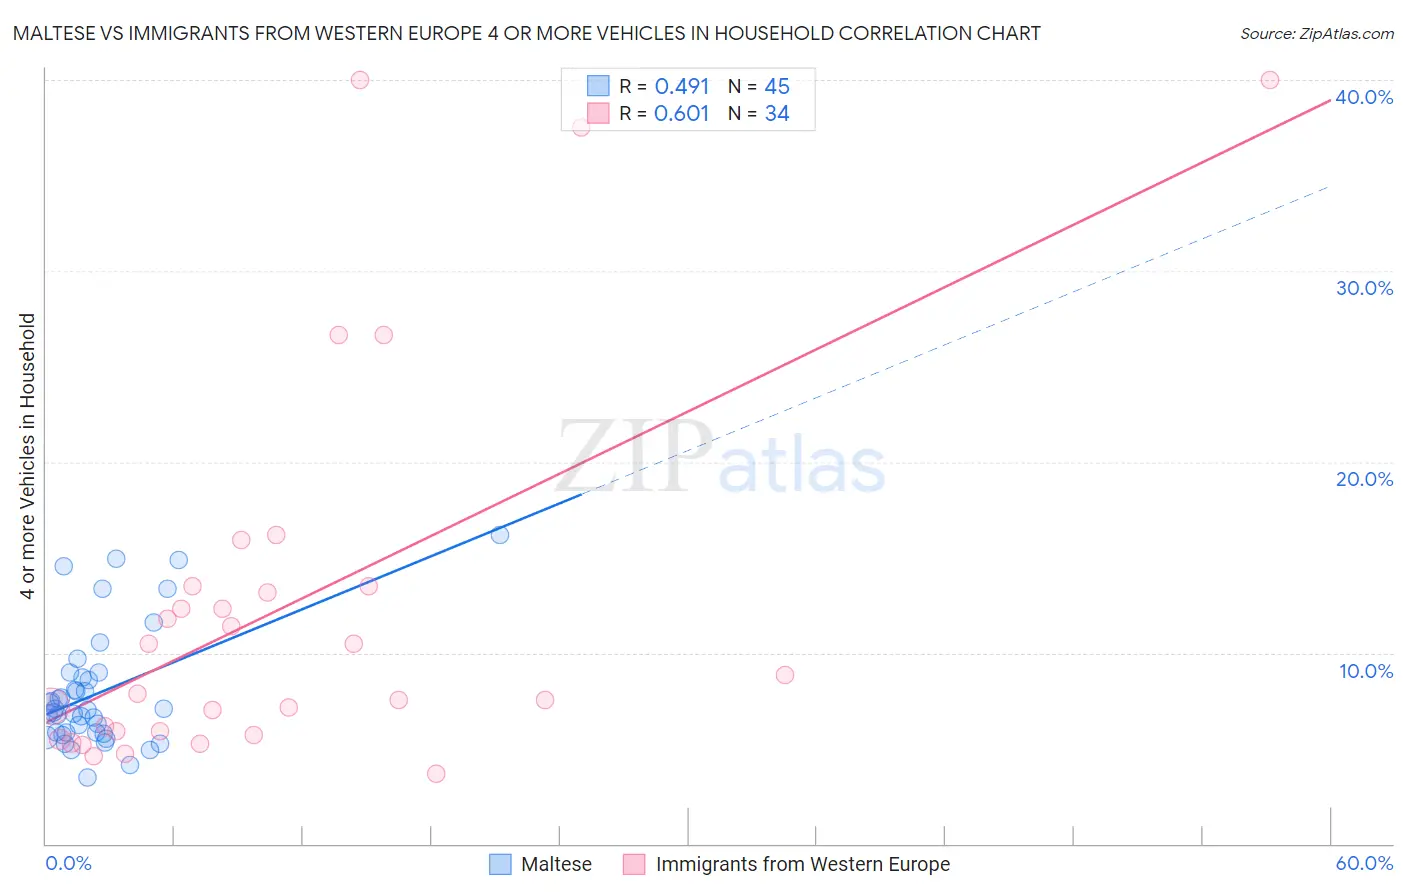
Maltese vs Immigrants from Western Europe 4 or more Vehicles in Household Correlation Chart
The statistical analysis conducted on geographies consisting of 125,931,665 people shows a moderate positive correlation between the proportion of Maltese and percentage of households with 4 or more vehicles available in the United States with a correlation coefficient (R) of 0.491 and weighted average of 6.7%. Similarly, the statistical analysis conducted on geographies consisting of 491,787,926 people shows a significant positive correlation between the proportion of Immigrants from Western Europe and percentage of households with 4 or more vehicles available in the United States with a correlation coefficient (R) of 0.601 and weighted average of 6.3%, a difference of 5.3%.
4 or more Vehicles in Household Correlation Summary
| Measurement | Maltese | Immigrants from Western Europe |
| Minimum | 3.5% | 3.7% |
| Maximum | 16.2% | 40.0% |
| Range | 12.7% | 36.3% |
| Mean | 7.9% | 12.4% |
| Median | 7.0% | 8.3% |
| Interquartile 25% (IQ1) | 5.8% | 5.9% |
| Interquartile 75% (IQ3) | 8.8% | 13.5% |
| Interquartile Range (IQR) | 3.0% | 7.6% |
| Standard Deviation (Sample) | 3.1% | 10.0% |
| Standard Deviation (Population) | 3.1% | 9.9% |
Similar Demographics by 4 or more Vehicles in Household
Demographics Similar to Maltese by 4 or more Vehicles in Household
In terms of 4 or more vehicles in household, the demographic groups most similar to Maltese are Immigrants from Netherlands (6.6%, a difference of 0.14%), Immigrants from Scotland (6.7%, a difference of 0.15%), Armenian (6.6%, a difference of 0.34%), Ottawa (6.6%, a difference of 0.35%), and Tohono O'odham (6.6%, a difference of 0.38%).
| Demographics | Rating | Rank | 4 or more Vehicles in Household |
| Immigrants | Asia | 94.4 /100 | #124 | Exceptional 6.8% |
| Austrians | 94.1 /100 | #125 | Exceptional 6.8% |
| Belgians | 94.1 /100 | #126 | Exceptional 6.8% |
| Immigrants | Korea | 93.8 /100 | #127 | Exceptional 6.8% |
| Immigrants | Bolivia | 92.5 /100 | #128 | Exceptional 6.7% |
| Immigrants | England | 92.0 /100 | #129 | Exceptional 6.7% |
| Immigrants | Scotland | 89.0 /100 | #130 | Excellent 6.7% |
| Maltese | 88.4 /100 | #131 | Excellent 6.7% |
| Immigrants | Netherlands | 87.8 /100 | #132 | Excellent 6.6% |
| Armenians | 86.9 /100 | #133 | Excellent 6.6% |
| Ottawa | 86.9 /100 | #134 | Excellent 6.6% |
| Tohono O'odham | 86.7 /100 | #135 | Excellent 6.6% |
| Luxembourgers | 86.4 /100 | #136 | Excellent 6.6% |
| French Canadians | 85.4 /100 | #137 | Excellent 6.6% |
| Italians | 84.5 /100 | #138 | Excellent 6.6% |
Demographics Similar to Immigrants from Western Europe by 4 or more Vehicles in Household
In terms of 4 or more vehicles in household, the demographic groups most similar to Immigrants from Western Europe are Lithuanian (6.3%, a difference of 0.12%), Ukrainian (6.3%, a difference of 0.12%), Slovak (6.3%, a difference of 0.20%), Slovene (6.3%, a difference of 0.24%), and Immigrants from Lebanon (6.3%, a difference of 0.29%).
| Demographics | Rating | Rank | 4 or more Vehicles in Household |
| Lebanese | 55.8 /100 | #168 | Average 6.4% |
| Estonians | 55.1 /100 | #169 | Average 6.4% |
| Immigrants | Syria | 52.8 /100 | #170 | Average 6.3% |
| Immigrants | India | 51.9 /100 | #171 | Average 6.3% |
| Immigrants | Lebanon | 51.7 /100 | #172 | Average 6.3% |
| Slovenes | 51.1 /100 | #173 | Average 6.3% |
| Lithuanians | 50.0 /100 | #174 | Average 6.3% |
| Immigrants | Western Europe | 48.8 /100 | #175 | Average 6.3% |
| Ukrainians | 47.6 /100 | #176 | Average 6.3% |
| Slovaks | 46.9 /100 | #177 | Average 6.3% |
| Belizeans | 44.5 /100 | #178 | Average 6.3% |
| Immigrants | Japan | 43.1 /100 | #179 | Average 6.3% |
| Syrians | 42.0 /100 | #180 | Average 6.3% |
| Yugoslavians | 41.1 /100 | #181 | Average 6.3% |
| South American Indians | 40.7 /100 | #182 | Average 6.3% |