Maltese vs Immigrants from Canada In Labor Force | Age 45-54
COMPARE
Maltese
Immigrants from Canada
In Labor Force | Age 45-54
In Labor Force | Age 45-54 Comparison
Maltese
Immigrants from Canada
83.3%
IN LABOR FORCE | AGE 45-54
94.4/ 100
METRIC RATING
98th/ 347
METRIC RANK
82.5%
IN LABOR FORCE | AGE 45-54
20.0/ 100
METRIC RATING
195th/ 347
METRIC RANK
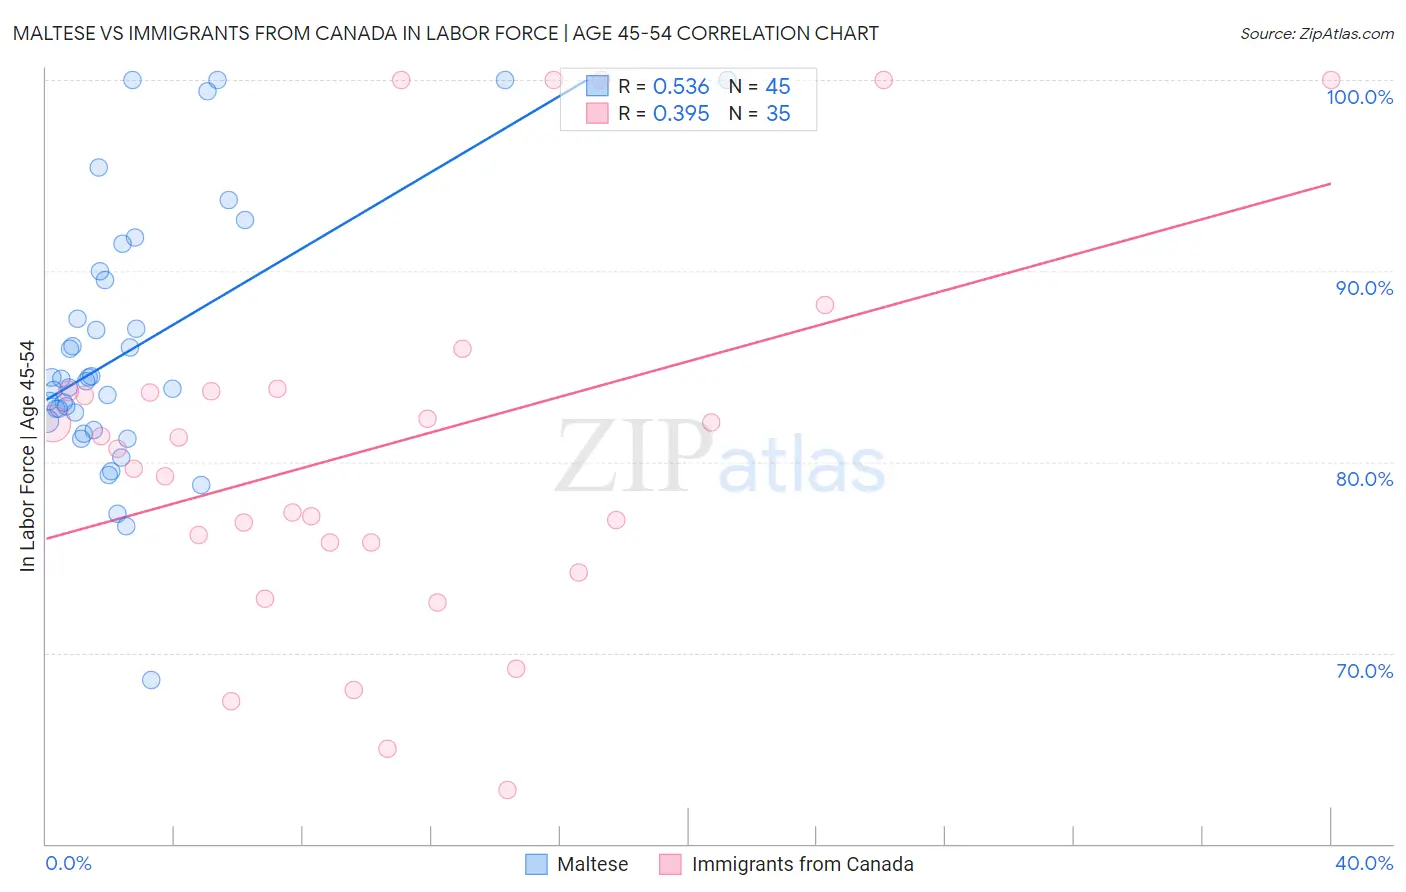
Maltese vs Immigrants from Canada In Labor Force | Age 45-54 Correlation Chart
The statistical analysis conducted on geographies consisting of 126,435,946 people shows a substantial positive correlation between the proportion of Maltese and labor force participation rate among population between the ages 45 and 54 in the United States with a correlation coefficient (R) of 0.536 and weighted average of 83.3%. Similarly, the statistical analysis conducted on geographies consisting of 459,096,447 people shows a mild positive correlation between the proportion of Immigrants from Canada and labor force participation rate among population between the ages 45 and 54 in the United States with a correlation coefficient (R) of 0.395 and weighted average of 82.5%, a difference of 0.93%.
In Labor Force | Age 45-54 Correlation Summary
| Measurement | Maltese | Immigrants from Canada |
| Minimum | 68.6% | 62.8% |
| Maximum | 100.0% | 100.0% |
| Range | 31.4% | 37.2% |
| Mean | 85.9% | 80.8% |
| Median | 84.2% | 80.7% |
| Interquartile 25% (IQ1) | 81.9% | 75.8% |
| Interquartile 75% (IQ3) | 89.8% | 83.7% |
| Interquartile Range (IQR) | 7.9% | 8.0% |
| Standard Deviation (Sample) | 6.9% | 9.9% |
| Standard Deviation (Population) | 6.8% | 9.7% |
Similar Demographics by In Labor Force | Age 45-54
Demographics Similar to Maltese by In Labor Force | Age 45-54
In terms of in labor force | age 45-54, the demographic groups most similar to Maltese are Palestinian (83.3%, a difference of 0.010%), Immigrants from Middle Africa (83.3%, a difference of 0.010%), Mongolian (83.3%, a difference of 0.010%), Immigrants from Belarus (83.3%, a difference of 0.010%), and Argentinean (83.3%, a difference of 0.020%).
| Demographics | Rating | Rank | In Labor Force | Age 45-54 |
| South Americans | 95.5 /100 | #91 | Exceptional 83.3% |
| Danes | 95.3 /100 | #92 | Exceptional 83.3% |
| Italians | 95.1 /100 | #93 | Exceptional 83.3% |
| Argentineans | 94.9 /100 | #94 | Exceptional 83.3% |
| Immigrants | Argentina | 94.9 /100 | #95 | Exceptional 83.3% |
| Immigrants | Kuwait | 94.8 /100 | #96 | Exceptional 83.3% |
| Palestinians | 94.8 /100 | #97 | Exceptional 83.3% |
| Maltese | 94.4 /100 | #98 | Exceptional 83.3% |
| Immigrants | Middle Africa | 94.3 /100 | #99 | Exceptional 83.3% |
| Mongolians | 94.2 /100 | #100 | Exceptional 83.3% |
| Immigrants | Belarus | 94.1 /100 | #101 | Exceptional 83.3% |
| Immigrants | Singapore | 93.9 /100 | #102 | Exceptional 83.3% |
| Albanians | 93.9 /100 | #103 | Exceptional 83.3% |
| Immigrants | Romania | 93.8 /100 | #104 | Exceptional 83.3% |
| Immigrants | South America | 93.5 /100 | #105 | Exceptional 83.2% |
Demographics Similar to Immigrants from Canada by In Labor Force | Age 45-54
In terms of in labor force | age 45-54, the demographic groups most similar to Immigrants from Canada are Immigrants from Iraq (82.5%, a difference of 0.010%), Australian (82.5%, a difference of 0.010%), Immigrants from Norway (82.5%, a difference of 0.010%), Immigrants from North America (82.5%, a difference of 0.020%), and Lebanese (82.5%, a difference of 0.030%).
| Demographics | Rating | Rank | In Labor Force | Age 45-54 |
| South Africans | 28.0 /100 | #188 | Fair 82.6% |
| Syrians | 26.0 /100 | #189 | Fair 82.6% |
| British | 25.7 /100 | #190 | Fair 82.6% |
| Armenians | 23.2 /100 | #191 | Fair 82.5% |
| Immigrants | Iraq | 20.9 /100 | #192 | Fair 82.5% |
| Australians | 20.8 /100 | #193 | Fair 82.5% |
| Immigrants | Norway | 20.7 /100 | #194 | Fair 82.5% |
| Immigrants | Canada | 20.0 /100 | #195 | Fair 82.5% |
| Immigrants | North America | 18.8 /100 | #196 | Poor 82.5% |
| Lebanese | 18.2 /100 | #197 | Poor 82.5% |
| Immigrants | Denmark | 17.9 /100 | #198 | Poor 82.5% |
| Moroccans | 15.7 /100 | #199 | Poor 82.5% |
| French Canadians | 15.4 /100 | #200 | Poor 82.5% |
| Canadians | 15.1 /100 | #201 | Poor 82.4% |
| Immigrants | Western Asia | 14.9 /100 | #202 | Poor 82.4% |