Immigrants from Liberia vs Immigrants from Canada 2 or more Vehicles in Household
COMPARE
Immigrants from Liberia
Immigrants from Canada
2 or more Vehicles in Household
2 or more Vehicles in Household Comparison
Immigrants from Liberia
Immigrants from Canada
51.3%
2 OR MORE VEHICLES IN HOUSEHOLD
0.1/ 100
METRIC RATING
286th/ 347
METRIC RANK
57.5%
2 OR MORE VEHICLES IN HOUSEHOLD
98.1/ 100
METRIC RATING
108th/ 347
METRIC RANK
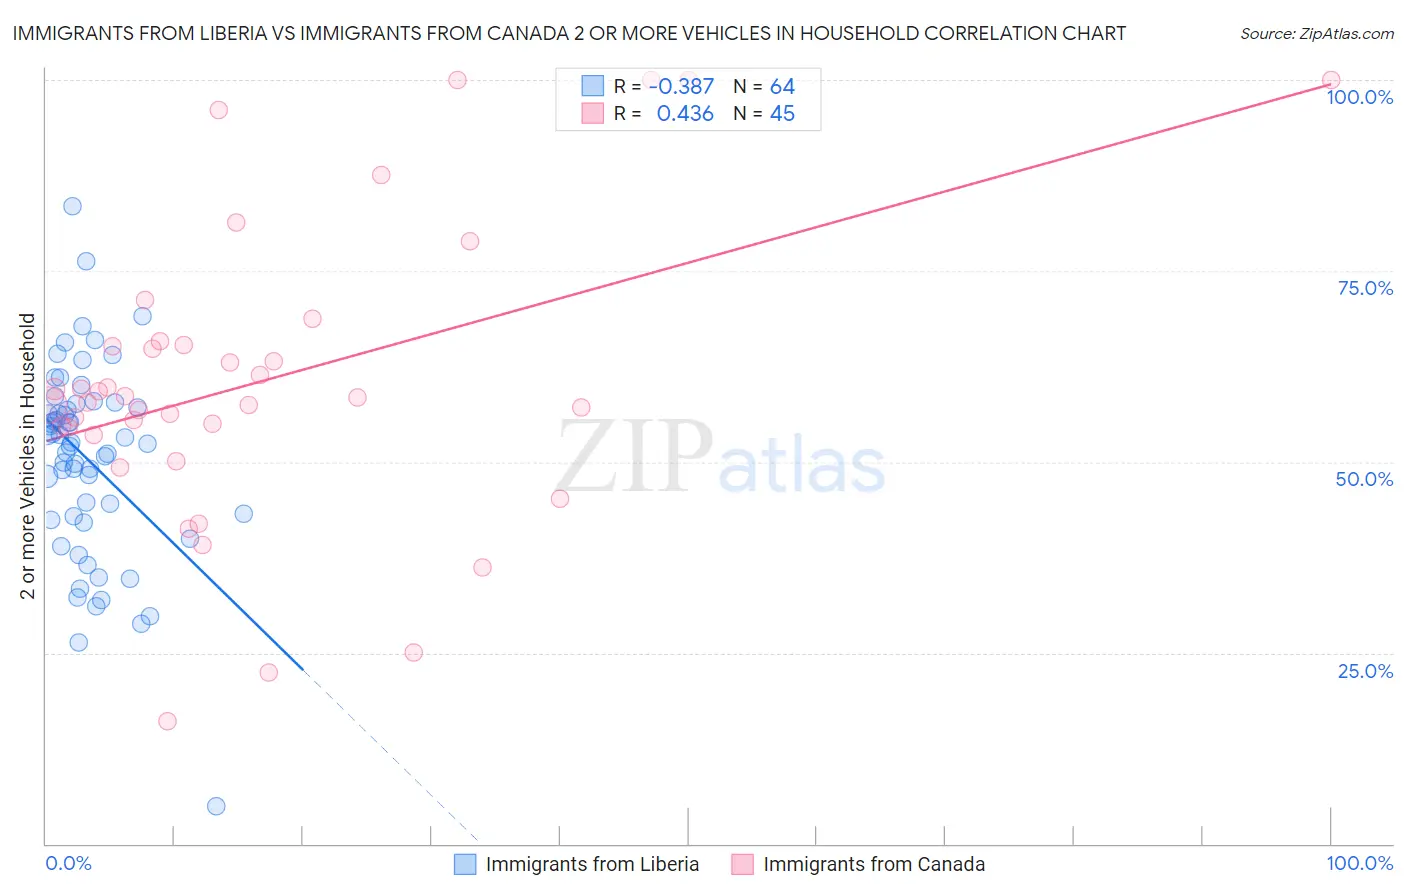
Immigrants from Liberia vs Immigrants from Canada 2 or more Vehicles in Household Correlation Chart
The statistical analysis conducted on geographies consisting of 135,251,590 people shows a mild negative correlation between the proportion of Immigrants from Liberia and percentage of households with 2 or more vehicles available in the United States with a correlation coefficient (R) of -0.387 and weighted average of 51.3%. Similarly, the statistical analysis conducted on geographies consisting of 459,158,975 people shows a moderate positive correlation between the proportion of Immigrants from Canada and percentage of households with 2 or more vehicles available in the United States with a correlation coefficient (R) of 0.436 and weighted average of 57.5%, a difference of 12.1%.
2 or more Vehicles in Household Correlation Summary
| Measurement | Immigrants from Liberia | Immigrants from Canada |
| Minimum | 4.9% | 16.0% |
| Maximum | 83.5% | 100.0% |
| Range | 78.6% | 84.0% |
| Mean | 50.3% | 60.6% |
| Median | 52.4% | 58.4% |
| Interquartile 25% (IQ1) | 42.7% | 54.1% |
| Interquartile 75% (IQ3) | 57.4% | 65.5% |
| Interquartile Range (IQR) | 14.7% | 11.4% |
| Standard Deviation (Sample) | 13.0% | 19.4% |
| Standard Deviation (Population) | 12.9% | 19.1% |
Similar Demographics by 2 or more Vehicles in Household
Demographics Similar to Immigrants from Liberia by 2 or more Vehicles in Household
In terms of 2 or more vehicles in household, the demographic groups most similar to Immigrants from Liberia are Immigrants from Serbia (51.3%, a difference of 0.020%), Immigrants from Uruguay (51.4%, a difference of 0.14%), Okinawan (51.2%, a difference of 0.14%), Immigrants from Zaire (51.5%, a difference of 0.30%), and Immigrants from China (51.5%, a difference of 0.34%).
| Demographics | Rating | Rank | 2 or more Vehicles in Household |
| Liberians | 0.1 /100 | #279 | Tragic 51.7% |
| Immigrants | Eastern Europe | 0.1 /100 | #280 | Tragic 51.7% |
| Immigrants | Kazakhstan | 0.1 /100 | #281 | Tragic 51.6% |
| Bahamians | 0.1 /100 | #282 | Tragic 51.5% |
| Immigrants | China | 0.1 /100 | #283 | Tragic 51.5% |
| Immigrants | Zaire | 0.1 /100 | #284 | Tragic 51.5% |
| Immigrants | Uruguay | 0.1 /100 | #285 | Tragic 51.4% |
| Immigrants | Liberia | 0.1 /100 | #286 | Tragic 51.3% |
| Immigrants | Serbia | 0.1 /100 | #287 | Tragic 51.3% |
| Okinawans | 0.1 /100 | #288 | Tragic 51.2% |
| Somalis | 0.0 /100 | #289 | Tragic 51.1% |
| Immigrants | Panama | 0.0 /100 | #290 | Tragic 51.1% |
| Belizeans | 0.0 /100 | #291 | Tragic 51.0% |
| Immigrants | Ukraine | 0.0 /100 | #292 | Tragic 50.9% |
| Blacks/African Americans | 0.0 /100 | #293 | Tragic 50.9% |
Demographics Similar to Immigrants from Canada by 2 or more Vehicles in Household
In terms of 2 or more vehicles in household, the demographic groups most similar to Immigrants from Canada are Immigrants from Netherlands (57.5%, a difference of 0.010%), Immigrants from Oceania (57.5%, a difference of 0.030%), Immigrants from North America (57.5%, a difference of 0.030%), Immigrants from Bolivia (57.6%, a difference of 0.050%), and Jordanian (57.6%, a difference of 0.050%).
| Demographics | Rating | Rank | 2 or more Vehicles in Household |
| Lebanese | 98.3 /100 | #101 | Exceptional 57.6% |
| Immigrants | Bolivia | 98.2 /100 | #102 | Exceptional 57.6% |
| Jordanians | 98.2 /100 | #103 | Exceptional 57.6% |
| Immigrants | Indonesia | 98.2 /100 | #104 | Exceptional 57.6% |
| Immigrants | Korea | 98.2 /100 | #105 | Exceptional 57.6% |
| Immigrants | Oceania | 98.2 /100 | #106 | Exceptional 57.5% |
| Immigrants | Netherlands | 98.2 /100 | #107 | Exceptional 57.5% |
| Immigrants | Canada | 98.1 /100 | #108 | Exceptional 57.5% |
| Immigrants | North America | 98.1 /100 | #109 | Exceptional 57.5% |
| Japanese | 98.0 /100 | #110 | Exceptional 57.5% |
| Greeks | 98.0 /100 | #111 | Exceptional 57.5% |
| Pueblo | 98.0 /100 | #112 | Exceptional 57.5% |
| Zimbabweans | 96.9 /100 | #113 | Exceptional 57.2% |
| Immigrants | Lebanon | 96.8 /100 | #114 | Exceptional 57.2% |
| Chippewa | 96.6 /100 | #115 | Exceptional 57.2% |