Macedonian vs Immigrants from Eastern Africa 1 or more Vehicles in Household
COMPARE
Macedonian
Immigrants from Eastern Africa
1 or more Vehicles in Household
1 or more Vehicles in Household Comparison
Macedonians
Immigrants from Eastern Africa
87.9%
1 OR MORE VEHICLES IN HOUSEHOLD
0.6/ 100
METRIC RATING
260th/ 347
METRIC RANK
90.1%
1 OR MORE VEHICLES IN HOUSEHOLD
78.2/ 100
METRIC RATING
148th/ 347
METRIC RANK
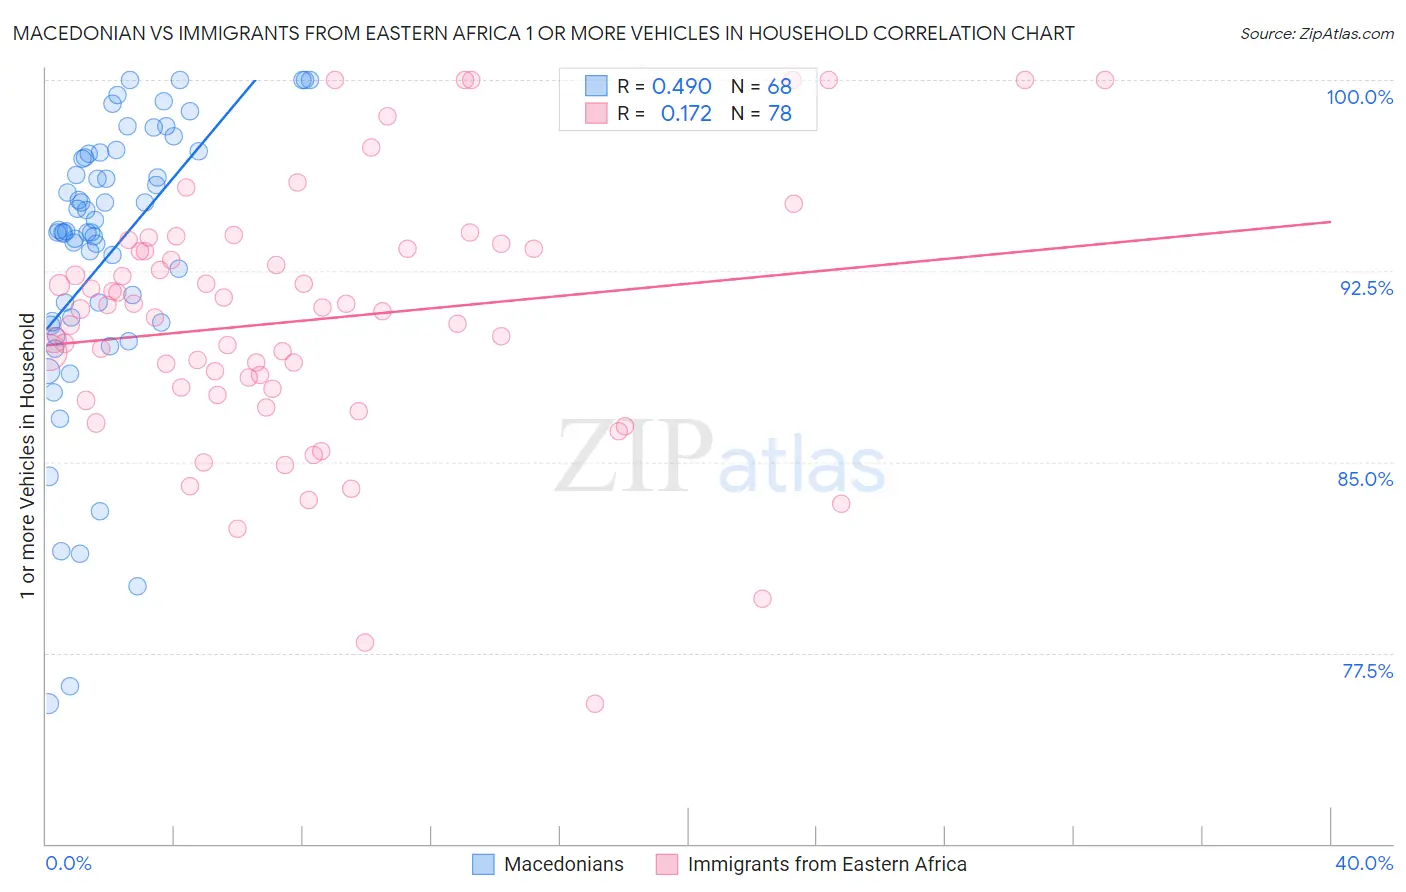
Macedonian vs Immigrants from Eastern Africa 1 or more Vehicles in Household Correlation Chart
The statistical analysis conducted on geographies consisting of 132,543,746 people shows a moderate positive correlation between the proportion of Macedonians and percentage of households with 1 or more vehicles available in the United States with a correlation coefficient (R) of 0.490 and weighted average of 87.9%. Similarly, the statistical analysis conducted on geographies consisting of 354,905,659 people shows a poor positive correlation between the proportion of Immigrants from Eastern Africa and percentage of households with 1 or more vehicles available in the United States with a correlation coefficient (R) of 0.172 and weighted average of 90.1%, a difference of 2.5%.
1 or more Vehicles in Household Correlation Summary
| Measurement | Macedonian | Immigrants from Eastern Africa |
| Minimum | 75.5% | 75.5% |
| Maximum | 100.0% | 100.0% |
| Range | 24.5% | 24.5% |
| Mean | 93.1% | 90.6% |
| Median | 94.0% | 91.0% |
| Interquartile 25% (IQ1) | 90.5% | 87.9% |
| Interquartile 75% (IQ3) | 97.0% | 93.4% |
| Interquartile Range (IQR) | 6.6% | 5.5% |
| Standard Deviation (Sample) | 5.6% | 5.0% |
| Standard Deviation (Population) | 5.5% | 5.0% |
Similar Demographics by 1 or more Vehicles in Household
Demographics Similar to Macedonians by 1 or more Vehicles in Household
In terms of 1 or more vehicles in household, the demographic groups most similar to Macedonians are Immigrants from Switzerland (87.9%, a difference of 0.040%), Subsaharan African (87.9%, a difference of 0.070%), Nigerian (88.0%, a difference of 0.090%), Colombian (88.0%, a difference of 0.12%), and Liberian (88.0%, a difference of 0.12%).
| Demographics | Rating | Rank | 1 or more Vehicles in Household |
| Hondurans | 1.0 /100 | #253 | Tragic 88.1% |
| Haitians | 0.9 /100 | #254 | Tragic 88.1% |
| Immigrants | Latvia | 0.9 /100 | #255 | Tragic 88.1% |
| Colombians | 0.9 /100 | #256 | Tragic 88.0% |
| Liberians | 0.9 /100 | #257 | Tragic 88.0% |
| South American Indians | 0.9 /100 | #258 | Tragic 88.0% |
| Nigerians | 0.8 /100 | #259 | Tragic 88.0% |
| Macedonians | 0.6 /100 | #260 | Tragic 87.9% |
| Immigrants | Switzerland | 0.6 /100 | #261 | Tragic 87.9% |
| Sub-Saharan Africans | 0.5 /100 | #262 | Tragic 87.9% |
| Immigrants | Egypt | 0.5 /100 | #263 | Tragic 87.8% |
| Immigrants | Liberia | 0.4 /100 | #264 | Tragic 87.8% |
| Africans | 0.4 /100 | #265 | Tragic 87.8% |
| Israelis | 0.3 /100 | #266 | Tragic 87.7% |
| Immigrants | Colombia | 0.3 /100 | #267 | Tragic 87.6% |
Demographics Similar to Immigrants from Eastern Africa by 1 or more Vehicles in Household
In terms of 1 or more vehicles in household, the demographic groups most similar to Immigrants from Eastern Africa are Immigrants from Nicaragua (90.1%, a difference of 0.030%), Chilean (90.2%, a difference of 0.040%), Bahamian (90.2%, a difference of 0.050%), Immigrants from Micronesia (90.1%, a difference of 0.050%), and Immigrants from Bosnia and Herzegovina (90.1%, a difference of 0.060%).
| Demographics | Rating | Rank | 1 or more Vehicles in Household |
| Immigrants | Moldova | 83.1 /100 | #141 | Excellent 90.2% |
| Immigrants | Lithuania | 83.0 /100 | #142 | Excellent 90.2% |
| Immigrants | Bahamas | 81.5 /100 | #143 | Excellent 90.2% |
| Immigrants | Zimbabwe | 81.5 /100 | #144 | Excellent 90.2% |
| Sioux | 81.3 /100 | #145 | Excellent 90.2% |
| Bahamians | 80.5 /100 | #146 | Excellent 90.2% |
| Chileans | 79.8 /100 | #147 | Good 90.2% |
| Immigrants | Eastern Africa | 78.2 /100 | #148 | Good 90.1% |
| Immigrants | Nicaragua | 76.7 /100 | #149 | Good 90.1% |
| Immigrants | Micronesia | 75.9 /100 | #150 | Good 90.1% |
| Immigrants | Bosnia and Herzegovina | 75.4 /100 | #151 | Good 90.1% |
| Tlingit-Haida | 74.3 /100 | #152 | Good 90.1% |
| New Zealanders | 73.8 /100 | #153 | Good 90.1% |
| Immigrants | Uganda | 73.8 /100 | #154 | Good 90.1% |
| Immigrants | Immigrants | 73.6 /100 | #155 | Good 90.1% |