Macedonian vs Navajo 1 or more Vehicles in Household
COMPARE
Macedonian
Navajo
1 or more Vehicles in Household
1 or more Vehicles in Household Comparison
Macedonians
Navajo
87.9%
1 OR MORE VEHICLES IN HOUSEHOLD
0.6/ 100
METRIC RATING
260th/ 347
METRIC RANK
90.8%
1 OR MORE VEHICLES IN HOUSEHOLD
95.8/ 100
METRIC RATING
111th/ 347
METRIC RANK
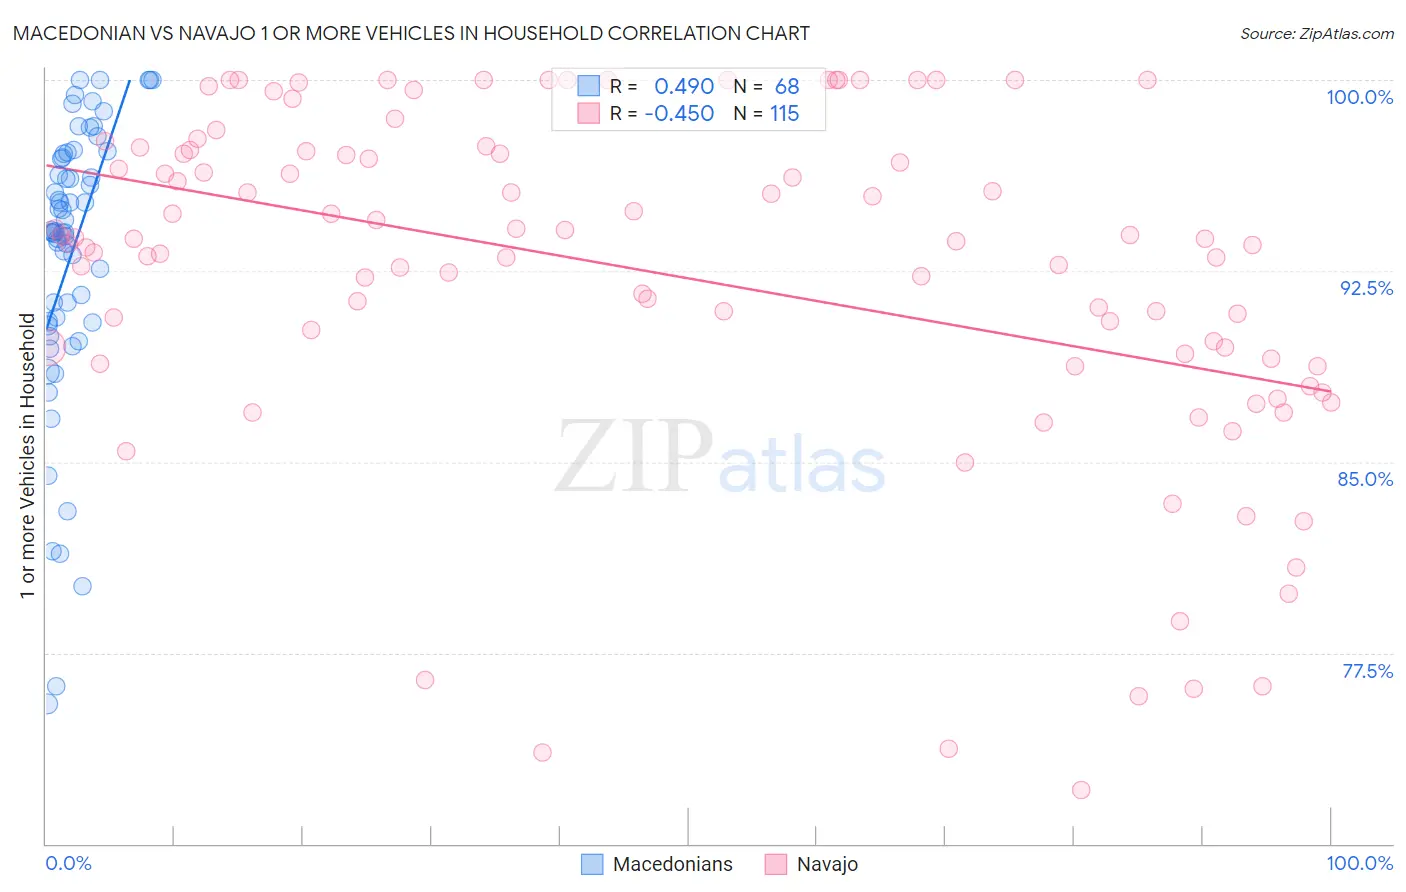
Macedonian vs Navajo 1 or more Vehicles in Household Correlation Chart
The statistical analysis conducted on geographies consisting of 132,543,746 people shows a moderate positive correlation between the proportion of Macedonians and percentage of households with 1 or more vehicles available in the United States with a correlation coefficient (R) of 0.490 and weighted average of 87.9%. Similarly, the statistical analysis conducted on geographies consisting of 224,767,823 people shows a moderate negative correlation between the proportion of Navajo and percentage of households with 1 or more vehicles available in the United States with a correlation coefficient (R) of -0.450 and weighted average of 90.8%, a difference of 3.2%.
1 or more Vehicles in Household Correlation Summary
| Measurement | Macedonian | Navajo |
| Minimum | 75.5% | 72.1% |
| Maximum | 100.0% | 100.0% |
| Range | 24.5% | 27.9% |
| Mean | 93.1% | 92.4% |
| Median | 94.0% | 93.7% |
| Interquartile 25% (IQ1) | 90.5% | 89.1% |
| Interquartile 75% (IQ3) | 97.0% | 97.2% |
| Interquartile Range (IQR) | 6.6% | 8.2% |
| Standard Deviation (Sample) | 5.6% | 6.7% |
| Standard Deviation (Population) | 5.5% | 6.7% |
Similar Demographics by 1 or more Vehicles in Household
Demographics Similar to Macedonians by 1 or more Vehicles in Household
In terms of 1 or more vehicles in household, the demographic groups most similar to Macedonians are Immigrants from Switzerland (87.9%, a difference of 0.040%), Subsaharan African (87.9%, a difference of 0.070%), Nigerian (88.0%, a difference of 0.090%), Colombian (88.0%, a difference of 0.12%), and Liberian (88.0%, a difference of 0.12%).
| Demographics | Rating | Rank | 1 or more Vehicles in Household |
| Hondurans | 1.0 /100 | #253 | Tragic 88.1% |
| Haitians | 0.9 /100 | #254 | Tragic 88.1% |
| Immigrants | Latvia | 0.9 /100 | #255 | Tragic 88.1% |
| Colombians | 0.9 /100 | #256 | Tragic 88.0% |
| Liberians | 0.9 /100 | #257 | Tragic 88.0% |
| South American Indians | 0.9 /100 | #258 | Tragic 88.0% |
| Nigerians | 0.8 /100 | #259 | Tragic 88.0% |
| Macedonians | 0.6 /100 | #260 | Tragic 87.9% |
| Immigrants | Switzerland | 0.6 /100 | #261 | Tragic 87.9% |
| Sub-Saharan Africans | 0.5 /100 | #262 | Tragic 87.9% |
| Immigrants | Egypt | 0.5 /100 | #263 | Tragic 87.8% |
| Immigrants | Liberia | 0.4 /100 | #264 | Tragic 87.8% |
| Africans | 0.4 /100 | #265 | Tragic 87.8% |
| Israelis | 0.3 /100 | #266 | Tragic 87.7% |
| Immigrants | Colombia | 0.3 /100 | #267 | Tragic 87.6% |
Demographics Similar to Navajo by 1 or more Vehicles in Household
In terms of 1 or more vehicles in household, the demographic groups most similar to Navajo are Immigrants from Netherlands (90.8%, a difference of 0.010%), Immigrants from Kuwait (90.7%, a difference of 0.090%), Armenian (90.7%, a difference of 0.11%), Serbian (90.7%, a difference of 0.12%), and Chippewa (90.7%, a difference of 0.13%).
| Demographics | Rating | Rank | 1 or more Vehicles in Household |
| Asians | 98.2 /100 | #104 | Exceptional 91.1% |
| Laotians | 98.0 /100 | #105 | Exceptional 91.0% |
| Zimbabweans | 97.7 /100 | #106 | Exceptional 91.0% |
| Maltese | 97.7 /100 | #107 | Exceptional 91.0% |
| Hispanics or Latinos | 97.6 /100 | #108 | Exceptional 91.0% |
| Delaware | 97.6 /100 | #109 | Exceptional 91.0% |
| Mexican American Indians | 97.4 /100 | #110 | Exceptional 91.0% |
| Navajo | 95.8 /100 | #111 | Exceptional 90.8% |
| Immigrants | Netherlands | 95.7 /100 | #112 | Exceptional 90.8% |
| Immigrants | Kuwait | 94.7 /100 | #113 | Exceptional 90.7% |
| Armenians | 94.5 /100 | #114 | Exceptional 90.7% |
| Serbians | 94.3 /100 | #115 | Exceptional 90.7% |
| Chippewa | 94.3 /100 | #116 | Exceptional 90.7% |
| Greeks | 93.5 /100 | #117 | Exceptional 90.6% |
| Japanese | 93.4 /100 | #118 | Exceptional 90.6% |