Macedonian vs Immigrants from Eastern Africa Male Poverty
COMPARE
Macedonian
Immigrants from Eastern Africa
Male Poverty
Male Poverty Comparison
Macedonians
Immigrants from Eastern Africa
9.7%
MALE POVERTY
99.5/ 100
METRIC RATING
32nd/ 347
METRIC RANK
12.0%
MALE POVERTY
5.4/ 100
METRIC RATING
206th/ 347
METRIC RANK
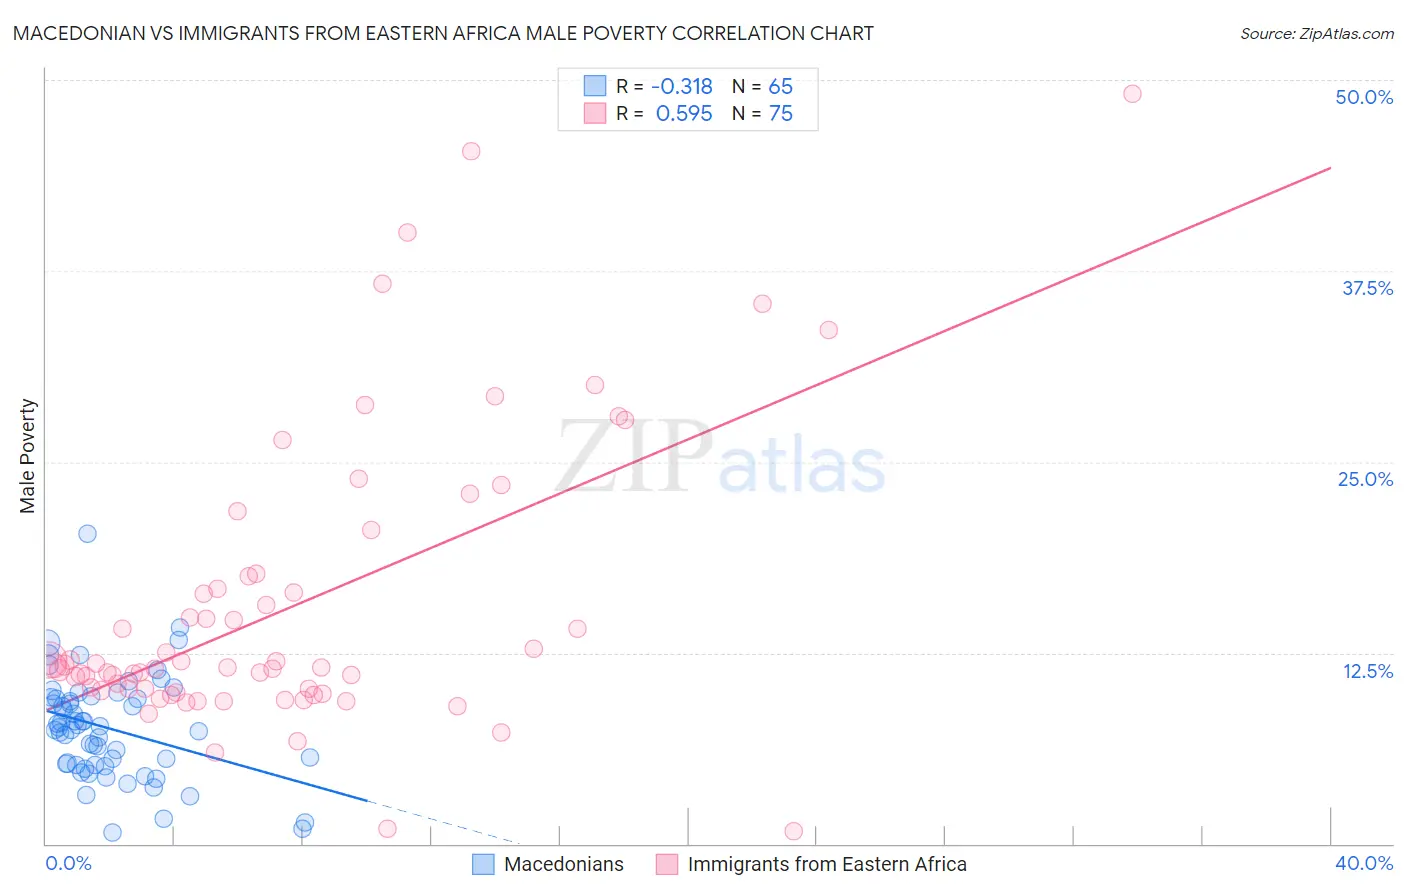
Macedonian vs Immigrants from Eastern Africa Male Poverty Correlation Chart
The statistical analysis conducted on geographies consisting of 132,583,851 people shows a mild negative correlation between the proportion of Macedonians and poverty level among males in the United States with a correlation coefficient (R) of -0.318 and weighted average of 9.7%. Similarly, the statistical analysis conducted on geographies consisting of 354,832,028 people shows a substantial positive correlation between the proportion of Immigrants from Eastern Africa and poverty level among males in the United States with a correlation coefficient (R) of 0.595 and weighted average of 12.0%, a difference of 23.0%.
Male Poverty Correlation Summary
| Measurement | Macedonian | Immigrants from Eastern Africa |
| Minimum | 0.75% | 0.81% |
| Maximum | 20.3% | 49.1% |
| Range | 19.6% | 48.3% |
| Mean | 7.6% | 15.6% |
| Median | 7.6% | 11.5% |
| Interquartile 25% (IQ1) | 5.1% | 10.0% |
| Interquartile 75% (IQ3) | 9.5% | 17.5% |
| Interquartile Range (IQR) | 4.4% | 7.5% |
| Standard Deviation (Sample) | 3.4% | 9.5% |
| Standard Deviation (Population) | 3.4% | 9.5% |
Similar Demographics by Male Poverty
Demographics Similar to Macedonians by Male Poverty
In terms of male poverty, the demographic groups most similar to Macedonians are Immigrants from Northern Europe (9.7%, a difference of 0.090%), Tongan (9.7%, a difference of 0.21%), Polish (9.7%, a difference of 0.23%), Immigrants from Poland (9.8%, a difference of 0.23%), and Greek (9.7%, a difference of 0.30%).
| Demographics | Rating | Rank | Male Poverty |
| Eastern Europeans | 99.6 /100 | #25 | Exceptional 9.6% |
| Burmese | 99.6 /100 | #26 | Exceptional 9.7% |
| Danes | 99.6 /100 | #27 | Exceptional 9.7% |
| Immigrants | Korea | 99.6 /100 | #28 | Exceptional 9.7% |
| Greeks | 99.6 /100 | #29 | Exceptional 9.7% |
| Poles | 99.5 /100 | #30 | Exceptional 9.7% |
| Tongans | 99.5 /100 | #31 | Exceptional 9.7% |
| Macedonians | 99.5 /100 | #32 | Exceptional 9.7% |
| Immigrants | Northern Europe | 99.5 /100 | #33 | Exceptional 9.7% |
| Immigrants | Poland | 99.5 /100 | #34 | Exceptional 9.8% |
| Iranians | 99.4 /100 | #35 | Exceptional 9.8% |
| Czechs | 99.4 /100 | #36 | Exceptional 9.8% |
| Immigrants | Greece | 99.3 /100 | #37 | Exceptional 9.8% |
| Immigrants | Pakistan | 99.2 /100 | #38 | Exceptional 9.9% |
| Russians | 99.2 /100 | #39 | Exceptional 9.9% |
Demographics Similar to Immigrants from Eastern Africa by Male Poverty
In terms of male poverty, the demographic groups most similar to Immigrants from Eastern Africa are Malaysian (12.0%, a difference of 0.10%), Panamanian (11.9%, a difference of 0.35%), Immigrants (12.0%, a difference of 0.43%), Immigrants from the Azores (12.0%, a difference of 0.54%), and Moroccan (12.0%, a difference of 0.60%).
| Demographics | Rating | Rank | Male Poverty |
| Spanish | 14.1 /100 | #199 | Poor 11.7% |
| Immigrants | Lebanon | 13.6 /100 | #200 | Poor 11.7% |
| Spaniards | 13.5 /100 | #201 | Poor 11.7% |
| Aleuts | 10.4 /100 | #202 | Poor 11.8% |
| Immigrants | Western Asia | 9.8 /100 | #203 | Tragic 11.8% |
| Immigrants | Uganda | 8.5 /100 | #204 | Tragic 11.8% |
| Panamanians | 6.2 /100 | #205 | Tragic 11.9% |
| Immigrants | Eastern Africa | 5.4 /100 | #206 | Tragic 12.0% |
| Malaysians | 5.2 /100 | #207 | Tragic 12.0% |
| Immigrants | Immigrants | 4.5 /100 | #208 | Tragic 12.0% |
| Immigrants | Azores | 4.3 /100 | #209 | Tragic 12.0% |
| Moroccans | 4.2 /100 | #210 | Tragic 12.0% |
| Immigrants | Panama | 4.0 /100 | #211 | Tragic 12.1% |
| Americans | 3.2 /100 | #212 | Tragic 12.1% |
| Immigrants | Nonimmigrants | 3.1 /100 | #213 | Tragic 12.1% |