Macedonian vs Immigrants from the Azores 1 or more Vehicles in Household
COMPARE
Macedonian
Immigrants from the Azores
1 or more Vehicles in Household
1 or more Vehicles in Household Comparison
Macedonians
Immigrants from the Azores
87.9%
1 OR MORE VEHICLES IN HOUSEHOLD
0.6/ 100
METRIC RATING
260th/ 347
METRIC RANK
90.4%
1 OR MORE VEHICLES IN HOUSEHOLD
89.1/ 100
METRIC RATING
127th/ 347
METRIC RANK
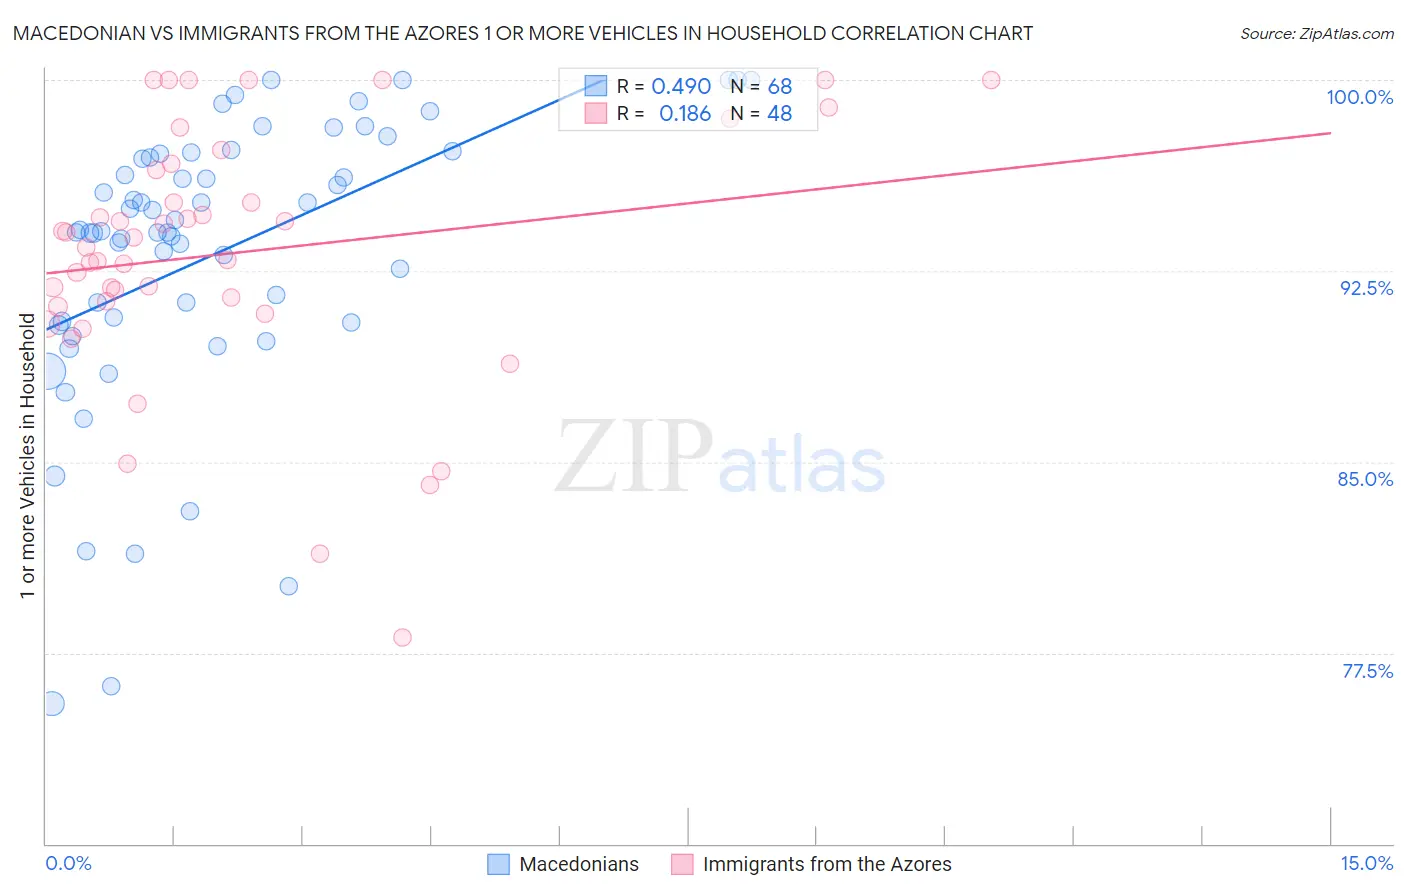
Macedonian vs Immigrants from the Azores 1 or more Vehicles in Household Correlation Chart
The statistical analysis conducted on geographies consisting of 132,543,746 people shows a moderate positive correlation between the proportion of Macedonians and percentage of households with 1 or more vehicles available in the United States with a correlation coefficient (R) of 0.490 and weighted average of 87.9%. Similarly, the statistical analysis conducted on geographies consisting of 46,255,729 people shows a poor positive correlation between the proportion of Immigrants from the Azores and percentage of households with 1 or more vehicles available in the United States with a correlation coefficient (R) of 0.186 and weighted average of 90.4%, a difference of 2.8%.
1 or more Vehicles in Household Correlation Summary
| Measurement | Macedonian | Immigrants from the Azores |
| Minimum | 75.5% | 78.1% |
| Maximum | 100.0% | 100.0% |
| Range | 24.5% | 21.9% |
| Mean | 93.1% | 93.2% |
| Median | 94.0% | 93.6% |
| Interquartile 25% (IQ1) | 90.5% | 91.2% |
| Interquartile 75% (IQ3) | 97.0% | 96.6% |
| Interquartile Range (IQR) | 6.6% | 5.4% |
| Standard Deviation (Sample) | 5.6% | 5.0% |
| Standard Deviation (Population) | 5.5% | 4.9% |
Similar Demographics by 1 or more Vehicles in Household
Demographics Similar to Macedonians by 1 or more Vehicles in Household
In terms of 1 or more vehicles in household, the demographic groups most similar to Macedonians are Immigrants from Switzerland (87.9%, a difference of 0.040%), Subsaharan African (87.9%, a difference of 0.070%), Nigerian (88.0%, a difference of 0.090%), Colombian (88.0%, a difference of 0.12%), and Liberian (88.0%, a difference of 0.12%).
| Demographics | Rating | Rank | 1 or more Vehicles in Household |
| Hondurans | 1.0 /100 | #253 | Tragic 88.1% |
| Haitians | 0.9 /100 | #254 | Tragic 88.1% |
| Immigrants | Latvia | 0.9 /100 | #255 | Tragic 88.1% |
| Colombians | 0.9 /100 | #256 | Tragic 88.0% |
| Liberians | 0.9 /100 | #257 | Tragic 88.0% |
| South American Indians | 0.9 /100 | #258 | Tragic 88.0% |
| Nigerians | 0.8 /100 | #259 | Tragic 88.0% |
| Macedonians | 0.6 /100 | #260 | Tragic 87.9% |
| Immigrants | Switzerland | 0.6 /100 | #261 | Tragic 87.9% |
| Sub-Saharan Africans | 0.5 /100 | #262 | Tragic 87.9% |
| Immigrants | Egypt | 0.5 /100 | #263 | Tragic 87.8% |
| Immigrants | Liberia | 0.4 /100 | #264 | Tragic 87.8% |
| Africans | 0.4 /100 | #265 | Tragic 87.8% |
| Israelis | 0.3 /100 | #266 | Tragic 87.7% |
| Immigrants | Colombia | 0.3 /100 | #267 | Tragic 87.6% |
Demographics Similar to Immigrants from the Azores by 1 or more Vehicles in Household
In terms of 1 or more vehicles in household, the demographic groups most similar to Immigrants from the Azores are Burmese (90.4%, a difference of 0.0%), Immigrants from Cameroon (90.4%, a difference of 0.010%), Marshallese (90.4%, a difference of 0.010%), Nicaraguan (90.4%, a difference of 0.010%), and Immigrants from Kenya (90.4%, a difference of 0.020%).
| Demographics | Rating | Rank | 1 or more Vehicles in Household |
| Immigrants | Thailand | 92.3 /100 | #120 | Exceptional 90.6% |
| Icelanders | 92.1 /100 | #121 | Exceptional 90.5% |
| Costa Ricans | 92.0 /100 | #122 | Exceptional 90.5% |
| Fijians | 91.8 /100 | #123 | Exceptional 90.5% |
| Puget Sound Salish | 91.5 /100 | #124 | Exceptional 90.5% |
| Immigrants | Korea | 90.5 /100 | #125 | Exceptional 90.5% |
| Immigrants | Cameroon | 89.4 /100 | #126 | Excellent 90.4% |
| Immigrants | Azores | 89.1 /100 | #127 | Excellent 90.4% |
| Burmese | 89.0 /100 | #128 | Excellent 90.4% |
| Marshallese | 88.9 /100 | #129 | Excellent 90.4% |
| Nicaraguans | 88.8 /100 | #130 | Excellent 90.4% |
| Immigrants | Kenya | 88.5 /100 | #131 | Excellent 90.4% |
| Immigrants | South Africa | 88.1 /100 | #132 | Excellent 90.4% |
| Immigrants | Syria | 87.5 /100 | #133 | Excellent 90.4% |
| Kenyans | 87.0 /100 | #134 | Excellent 90.4% |