Ghanaian vs Immigrants from Uruguay 2 or more Vehicles in Household
COMPARE
Ghanaian
Immigrants from Uruguay
2 or more Vehicles in Household
2 or more Vehicles in Household Comparison
Ghanaians
Immigrants from Uruguay
48.0%
2 OR MORE VEHICLES IN HOUSEHOLD
0.0/ 100
METRIC RATING
310th/ 347
METRIC RANK
51.4%
2 OR MORE VEHICLES IN HOUSEHOLD
0.1/ 100
METRIC RATING
285th/ 347
METRIC RANK
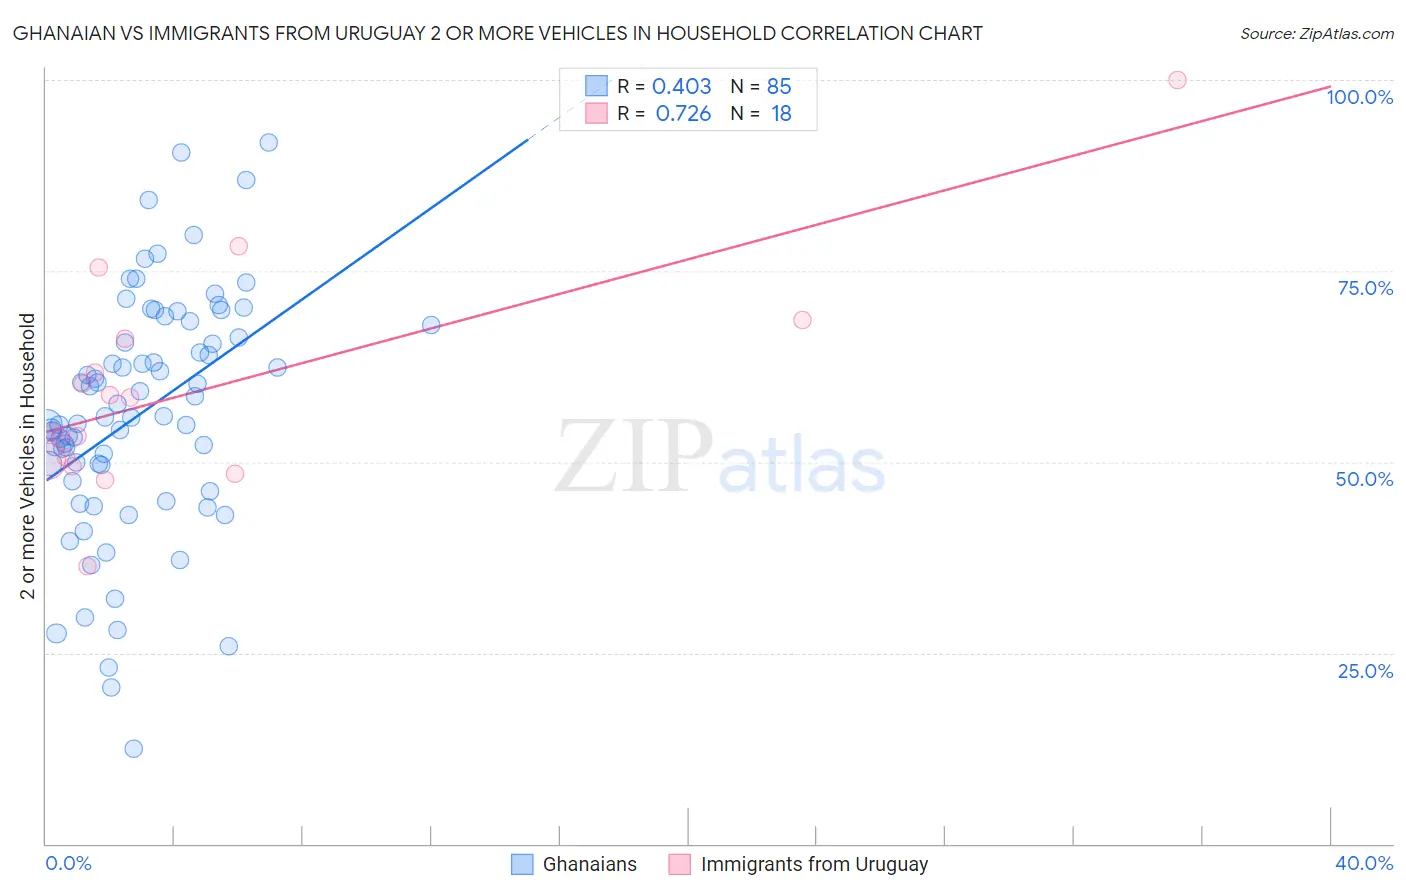
Ghanaian vs Immigrants from Uruguay 2 or more Vehicles in Household Correlation Chart
The statistical analysis conducted on geographies consisting of 190,548,121 people shows a moderate positive correlation between the proportion of Ghanaians and percentage of households with 2 or more vehicles available in the United States with a correlation coefficient (R) of 0.403 and weighted average of 48.0%. Similarly, the statistical analysis conducted on geographies consisting of 133,245,142 people shows a strong positive correlation between the proportion of Immigrants from Uruguay and percentage of households with 2 or more vehicles available in the United States with a correlation coefficient (R) of 0.726 and weighted average of 51.4%, a difference of 7.1%.
2 or more Vehicles in Household Correlation Summary
| Measurement | Ghanaian | Immigrants from Uruguay |
| Minimum | 12.4% | 36.3% |
| Maximum | 91.9% | 100.0% |
| Range | 79.5% | 63.7% |
| Mean | 56.3% | 59.5% |
| Median | 55.9% | 56.2% |
| Interquartile 25% (IQ1) | 48.5% | 50.1% |
| Interquartile 75% (IQ3) | 67.2% | 66.0% |
| Interquartile Range (IQR) | 18.7% | 16.0% |
| Standard Deviation (Sample) | 15.6% | 14.5% |
| Standard Deviation (Population) | 15.5% | 14.1% |
Similar Demographics by 2 or more Vehicles in Household
Demographics Similar to Ghanaians by 2 or more Vehicles in Household
In terms of 2 or more vehicles in household, the demographic groups most similar to Ghanaians are Immigrants from Belarus (47.9%, a difference of 0.12%), Haitian (47.6%, a difference of 0.86%), U.S. Virgin Islander (47.5%, a difference of 1.0%), Immigrants from Ghana (47.4%, a difference of 1.3%), and Moroccan (48.8%, a difference of 1.8%).
| Demographics | Rating | Rank | 2 or more Vehicles in Household |
| Tohono O'odham | 0.0 /100 | #303 | Tragic 50.0% |
| Immigrants | Belize | 0.0 /100 | #304 | Tragic 49.9% |
| Immigrants | Western Africa | 0.0 /100 | #305 | Tragic 49.4% |
| Immigrants | Israel | 0.0 /100 | #306 | Tragic 49.2% |
| Hopi | 0.0 /100 | #307 | Tragic 49.0% |
| Albanians | 0.0 /100 | #308 | Tragic 49.0% |
| Moroccans | 0.0 /100 | #309 | Tragic 48.8% |
| Ghanaians | 0.0 /100 | #310 | Tragic 48.0% |
| Immigrants | Belarus | 0.0 /100 | #311 | Tragic 47.9% |
| Haitians | 0.0 /100 | #312 | Tragic 47.6% |
| U.S. Virgin Islanders | 0.0 /100 | #313 | Tragic 47.5% |
| Immigrants | Ghana | 0.0 /100 | #314 | Tragic 47.4% |
| Puerto Ricans | 0.0 /100 | #315 | Tragic 47.1% |
| Cape Verdeans | 0.0 /100 | #316 | Tragic 46.8% |
| Immigrants | Haiti | 0.0 /100 | #317 | Tragic 46.5% |
Demographics Similar to Immigrants from Uruguay by 2 or more Vehicles in Household
In terms of 2 or more vehicles in household, the demographic groups most similar to Immigrants from Uruguay are Immigrants from Liberia (51.3%, a difference of 0.14%), Immigrants from Zaire (51.5%, a difference of 0.16%), Immigrants from Serbia (51.3%, a difference of 0.17%), Immigrants from China (51.5%, a difference of 0.20%), and Bahamian (51.5%, a difference of 0.28%).
| Demographics | Rating | Rank | 2 or more Vehicles in Household |
| Yuman | 0.1 /100 | #278 | Tragic 51.7% |
| Liberians | 0.1 /100 | #279 | Tragic 51.7% |
| Immigrants | Eastern Europe | 0.1 /100 | #280 | Tragic 51.7% |
| Immigrants | Kazakhstan | 0.1 /100 | #281 | Tragic 51.6% |
| Bahamians | 0.1 /100 | #282 | Tragic 51.5% |
| Immigrants | China | 0.1 /100 | #283 | Tragic 51.5% |
| Immigrants | Zaire | 0.1 /100 | #284 | Tragic 51.5% |
| Immigrants | Uruguay | 0.1 /100 | #285 | Tragic 51.4% |
| Immigrants | Liberia | 0.1 /100 | #286 | Tragic 51.3% |
| Immigrants | Serbia | 0.1 /100 | #287 | Tragic 51.3% |
| Okinawans | 0.1 /100 | #288 | Tragic 51.2% |
| Somalis | 0.0 /100 | #289 | Tragic 51.1% |
| Immigrants | Panama | 0.0 /100 | #290 | Tragic 51.1% |
| Belizeans | 0.0 /100 | #291 | Tragic 51.0% |
| Immigrants | Ukraine | 0.0 /100 | #292 | Tragic 50.9% |