Potawatomi vs Immigrants from Uruguay 2 or more Vehicles in Household
COMPARE
Potawatomi
Immigrants from Uruguay
2 or more Vehicles in Household
2 or more Vehicles in Household Comparison
Potawatomi
Immigrants from Uruguay
58.0%
2 OR MORE VEHICLES IN HOUSEHOLD
99.1/ 100
METRIC RATING
86th/ 347
METRIC RANK
51.4%
2 OR MORE VEHICLES IN HOUSEHOLD
0.1/ 100
METRIC RATING
285th/ 347
METRIC RANK
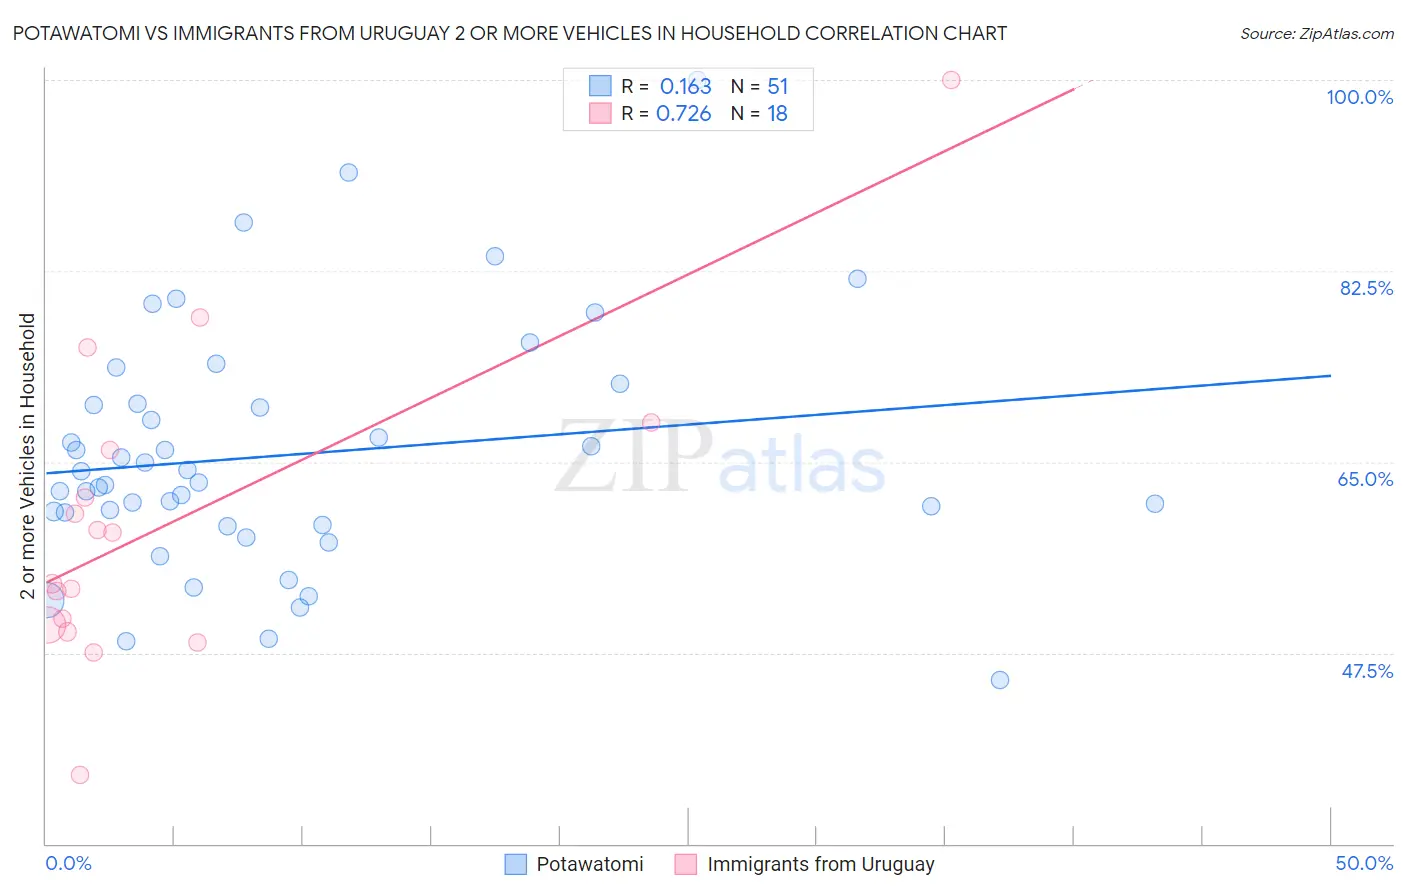
Potawatomi vs Immigrants from Uruguay 2 or more Vehicles in Household Correlation Chart
The statistical analysis conducted on geographies consisting of 117,759,902 people shows a poor positive correlation between the proportion of Potawatomi and percentage of households with 2 or more vehicles available in the United States with a correlation coefficient (R) of 0.163 and weighted average of 58.0%. Similarly, the statistical analysis conducted on geographies consisting of 133,245,142 people shows a strong positive correlation between the proportion of Immigrants from Uruguay and percentage of households with 2 or more vehicles available in the United States with a correlation coefficient (R) of 0.726 and weighted average of 51.4%, a difference of 12.8%.
2 or more Vehicles in Household Correlation Summary
| Measurement | Potawatomi | Immigrants from Uruguay |
| Minimum | 45.0% | 36.3% |
| Maximum | 100.0% | 100.0% |
| Range | 55.0% | 63.7% |
| Mean | 65.6% | 59.5% |
| Median | 63.1% | 56.2% |
| Interquartile 25% (IQ1) | 59.2% | 50.1% |
| Interquartile 75% (IQ3) | 70.3% | 66.0% |
| Interquartile Range (IQR) | 11.1% | 16.0% |
| Standard Deviation (Sample) | 11.1% | 14.5% |
| Standard Deviation (Population) | 11.0% | 14.1% |
Similar Demographics by 2 or more Vehicles in Household
Demographics Similar to Potawatomi by 2 or more Vehicles in Household
In terms of 2 or more vehicles in household, the demographic groups most similar to Potawatomi are Slovak (58.0%, a difference of 0.030%), Thai (57.9%, a difference of 0.040%), Immigrants from Iran (57.9%, a difference of 0.050%), Maltese (58.0%, a difference of 0.080%), and Icelander (58.0%, a difference of 0.11%).
| Demographics | Rating | Rank | 2 or more Vehicles in Household |
| Delaware | 99.4 /100 | #79 | Exceptional 58.2% |
| Immigrants | England | 99.3 /100 | #80 | Exceptional 58.1% |
| Immigrants | Iraq | 99.3 /100 | #81 | Exceptional 58.1% |
| Iranians | 99.3 /100 | #82 | Exceptional 58.1% |
| Icelanders | 99.2 /100 | #83 | Exceptional 58.0% |
| Maltese | 99.2 /100 | #84 | Exceptional 58.0% |
| Slovaks | 99.2 /100 | #85 | Exceptional 58.0% |
| Potawatomi | 99.1 /100 | #86 | Exceptional 58.0% |
| Thais | 99.1 /100 | #87 | Exceptional 57.9% |
| Immigrants | Iran | 99.1 /100 | #88 | Exceptional 57.9% |
| Immigrants | Germany | 99.0 /100 | #89 | Exceptional 57.9% |
| Hispanics or Latinos | 99.0 /100 | #90 | Exceptional 57.9% |
| Pakistanis | 99.0 /100 | #91 | Exceptional 57.9% |
| Shoshone | 99.0 /100 | #92 | Exceptional 57.9% |
| Ottawa | 99.0 /100 | #93 | Exceptional 57.9% |
Demographics Similar to Immigrants from Uruguay by 2 or more Vehicles in Household
In terms of 2 or more vehicles in household, the demographic groups most similar to Immigrants from Uruguay are Immigrants from Liberia (51.3%, a difference of 0.14%), Immigrants from Zaire (51.5%, a difference of 0.16%), Immigrants from Serbia (51.3%, a difference of 0.17%), Immigrants from China (51.5%, a difference of 0.20%), and Bahamian (51.5%, a difference of 0.28%).
| Demographics | Rating | Rank | 2 or more Vehicles in Household |
| Yuman | 0.1 /100 | #278 | Tragic 51.7% |
| Liberians | 0.1 /100 | #279 | Tragic 51.7% |
| Immigrants | Eastern Europe | 0.1 /100 | #280 | Tragic 51.7% |
| Immigrants | Kazakhstan | 0.1 /100 | #281 | Tragic 51.6% |
| Bahamians | 0.1 /100 | #282 | Tragic 51.5% |
| Immigrants | China | 0.1 /100 | #283 | Tragic 51.5% |
| Immigrants | Zaire | 0.1 /100 | #284 | Tragic 51.5% |
| Immigrants | Uruguay | 0.1 /100 | #285 | Tragic 51.4% |
| Immigrants | Liberia | 0.1 /100 | #286 | Tragic 51.3% |
| Immigrants | Serbia | 0.1 /100 | #287 | Tragic 51.3% |
| Okinawans | 0.1 /100 | #288 | Tragic 51.2% |
| Somalis | 0.0 /100 | #289 | Tragic 51.1% |
| Immigrants | Panama | 0.0 /100 | #290 | Tragic 51.1% |
| Belizeans | 0.0 /100 | #291 | Tragic 51.0% |
| Immigrants | Ukraine | 0.0 /100 | #292 | Tragic 50.9% |