Lithuanian vs Aleut 4 or more Vehicles in Household
COMPARE
Lithuanian
Aleut
4 or more Vehicles in Household
4 or more Vehicles in Household Comparison
Lithuanians
Aleuts
6.3%
4 OR MORE VEHICLES IN HOUSEHOLD
50.0/ 100
METRIC RATING
174th/ 347
METRIC RANK
6.9%
4 OR MORE VEHICLES IN HOUSEHOLD
97.0/ 100
METRIC RATING
111th/ 347
METRIC RANK
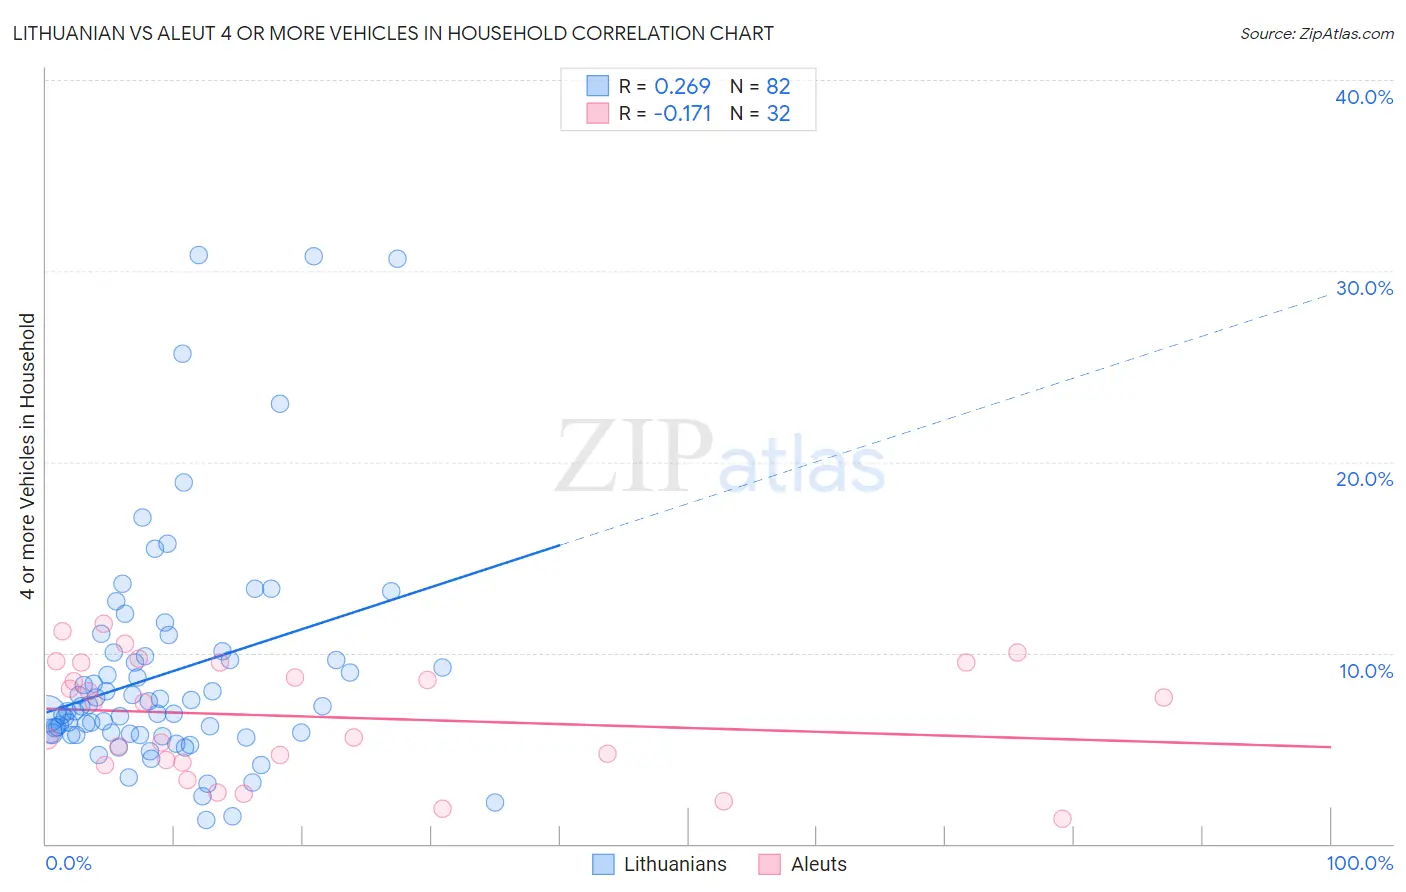
Lithuanian vs Aleut 4 or more Vehicles in Household Correlation Chart
The statistical analysis conducted on geographies consisting of 420,091,012 people shows a weak positive correlation between the proportion of Lithuanians and percentage of households with 4 or more vehicles available in the United States with a correlation coefficient (R) of 0.269 and weighted average of 6.3%. Similarly, the statistical analysis conducted on geographies consisting of 61,735,509 people shows a poor negative correlation between the proportion of Aleuts and percentage of households with 4 or more vehicles available in the United States with a correlation coefficient (R) of -0.171 and weighted average of 6.9%, a difference of 8.8%.
4 or more Vehicles in Household Correlation Summary
| Measurement | Lithuanian | Aleut |
| Minimum | 1.3% | 1.3% |
| Maximum | 30.8% | 11.5% |
| Range | 29.6% | 10.3% |
| Mean | 8.9% | 6.7% |
| Median | 7.1% | 7.4% |
| Interquartile 25% (IQ1) | 5.8% | 4.3% |
| Interquartile 75% (IQ3) | 9.8% | 9.5% |
| Interquartile Range (IQR) | 4.1% | 5.2% |
| Standard Deviation (Sample) | 6.0% | 3.0% |
| Standard Deviation (Population) | 6.0% | 2.9% |
Similar Demographics by 4 or more Vehicles in Household
Demographics Similar to Lithuanians by 4 or more Vehicles in Household
In terms of 4 or more vehicles in household, the demographic groups most similar to Lithuanians are Slovene (6.3%, a difference of 0.12%), Immigrants from Western Europe (6.3%, a difference of 0.12%), Immigrants from Lebanon (6.3%, a difference of 0.17%), Immigrants from India (6.3%, a difference of 0.20%), and Ukrainian (6.3%, a difference of 0.24%).
| Demographics | Rating | Rank | 4 or more Vehicles in Household |
| Poles | 56.9 /100 | #167 | Average 6.4% |
| Lebanese | 55.8 /100 | #168 | Average 6.4% |
| Estonians | 55.1 /100 | #169 | Average 6.4% |
| Immigrants | Syria | 52.8 /100 | #170 | Average 6.3% |
| Immigrants | India | 51.9 /100 | #171 | Average 6.3% |
| Immigrants | Lebanon | 51.7 /100 | #172 | Average 6.3% |
| Slovenes | 51.1 /100 | #173 | Average 6.3% |
| Lithuanians | 50.0 /100 | #174 | Average 6.3% |
| Immigrants | Western Europe | 48.8 /100 | #175 | Average 6.3% |
| Ukrainians | 47.6 /100 | #176 | Average 6.3% |
| Slovaks | 46.9 /100 | #177 | Average 6.3% |
| Belizeans | 44.5 /100 | #178 | Average 6.3% |
| Immigrants | Japan | 43.1 /100 | #179 | Average 6.3% |
| Syrians | 42.0 /100 | #180 | Average 6.3% |
| Yugoslavians | 41.1 /100 | #181 | Average 6.3% |
Demographics Similar to Aleuts by 4 or more Vehicles in Household
In terms of 4 or more vehicles in household, the demographic groups most similar to Aleuts are Hopi (6.9%, a difference of 0.010%), Immigrants from Thailand (6.9%, a difference of 0.020%), Canadian (6.9%, a difference of 0.43%), Bolivian (6.8%, a difference of 0.48%), and Filipino (6.9%, a difference of 0.53%).
| Demographics | Rating | Rank | 4 or more Vehicles in Household |
| Hmong | 98.3 /100 | #104 | Exceptional 7.0% |
| German Russians | 98.3 /100 | #105 | Exceptional 7.0% |
| Guatemalans | 98.1 /100 | #106 | Exceptional 7.0% |
| Nicaraguans | 98.0 /100 | #107 | Exceptional 7.0% |
| French | 97.7 /100 | #108 | Exceptional 6.9% |
| Filipinos | 97.6 /100 | #109 | Exceptional 6.9% |
| Immigrants | Thailand | 97.0 /100 | #110 | Exceptional 6.9% |
| Aleuts | 97.0 /100 | #111 | Exceptional 6.9% |
| Hopi | 97.0 /100 | #112 | Exceptional 6.9% |
| Canadians | 96.4 /100 | #113 | Exceptional 6.9% |
| Bolivians | 96.3 /100 | #114 | Exceptional 6.8% |
| Tlingit-Haida | 96.2 /100 | #115 | Exceptional 6.8% |
| Immigrants | Guatemala | 95.8 /100 | #116 | Exceptional 6.8% |
| Burmese | 95.7 /100 | #117 | Exceptional 6.8% |
| French American Indians | 95.7 /100 | #118 | Exceptional 6.8% |