Lithuanian vs Immigrants from Dominica 4 or more Vehicles in Household
COMPARE
Lithuanian
Immigrants from Dominica
4 or more Vehicles in Household
4 or more Vehicles in Household Comparison
Lithuanians
Immigrants from Dominica
6.3%
4 OR MORE VEHICLES IN HOUSEHOLD
50.0/ 100
METRIC RATING
174th/ 347
METRIC RANK
4.2%
4 OR MORE VEHICLES IN HOUSEHOLD
0.0/ 100
METRIC RATING
332nd/ 347
METRIC RANK
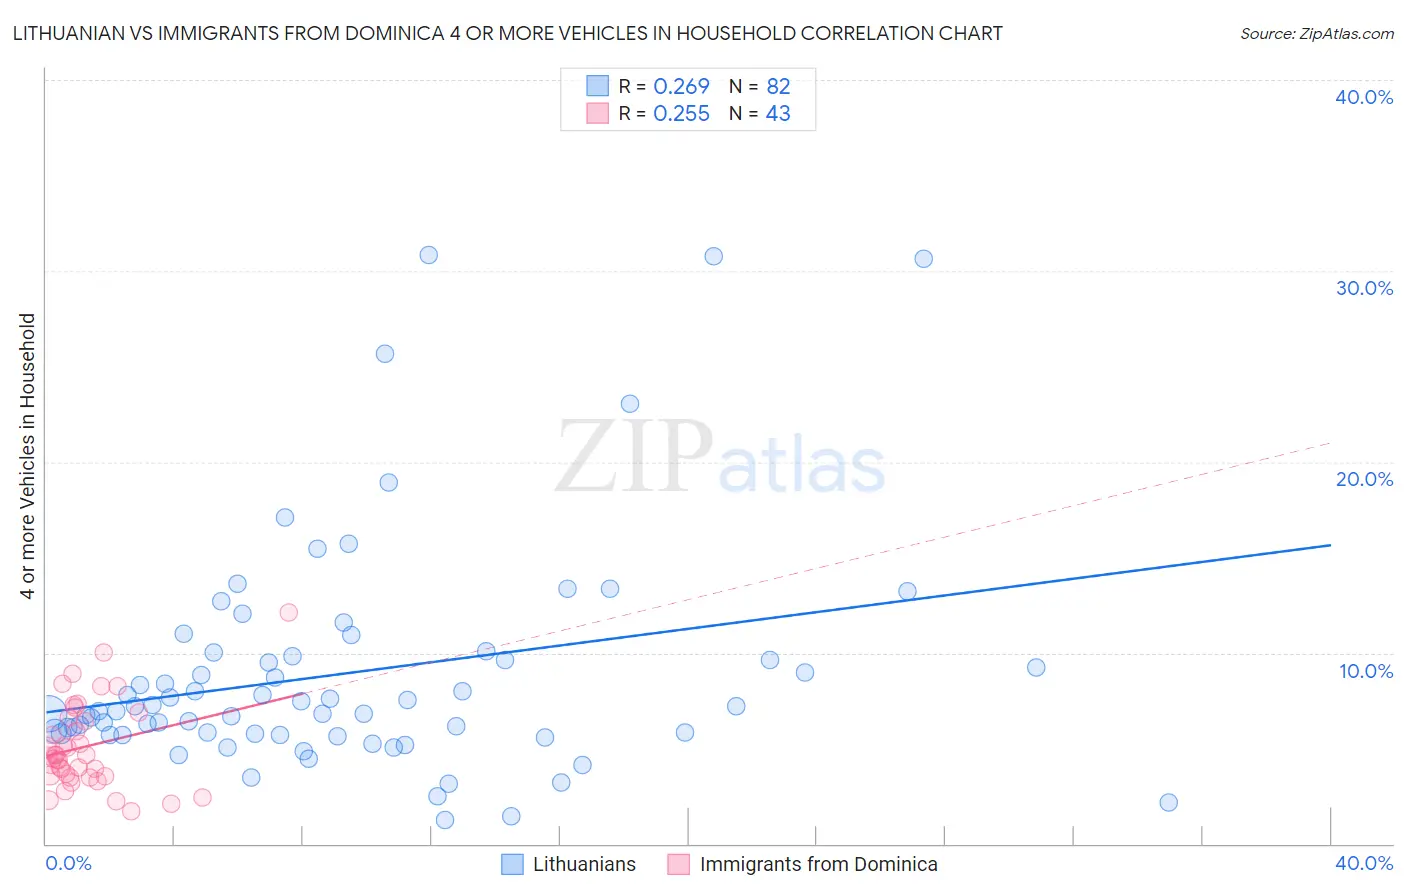
Lithuanian vs Immigrants from Dominica 4 or more Vehicles in Household Correlation Chart
The statistical analysis conducted on geographies consisting of 420,091,012 people shows a weak positive correlation between the proportion of Lithuanians and percentage of households with 4 or more vehicles available in the United States with a correlation coefficient (R) of 0.269 and weighted average of 6.3%. Similarly, the statistical analysis conducted on geographies consisting of 83,319,192 people shows a weak positive correlation between the proportion of Immigrants from Dominica and percentage of households with 4 or more vehicles available in the United States with a correlation coefficient (R) of 0.255 and weighted average of 4.2%, a difference of 51.1%.
4 or more Vehicles in Household Correlation Summary
| Measurement | Lithuanian | Immigrants from Dominica |
| Minimum | 1.3% | 1.7% |
| Maximum | 30.8% | 12.1% |
| Range | 29.6% | 10.4% |
| Mean | 8.9% | 5.1% |
| Median | 7.1% | 4.6% |
| Interquartile 25% (IQ1) | 5.8% | 3.5% |
| Interquartile 75% (IQ3) | 9.8% | 6.6% |
| Interquartile Range (IQR) | 4.1% | 3.1% |
| Standard Deviation (Sample) | 6.0% | 2.3% |
| Standard Deviation (Population) | 6.0% | 2.2% |
Similar Demographics by 4 or more Vehicles in Household
Demographics Similar to Lithuanians by 4 or more Vehicles in Household
In terms of 4 or more vehicles in household, the demographic groups most similar to Lithuanians are Slovene (6.3%, a difference of 0.12%), Immigrants from Western Europe (6.3%, a difference of 0.12%), Immigrants from Lebanon (6.3%, a difference of 0.17%), Immigrants from India (6.3%, a difference of 0.20%), and Ukrainian (6.3%, a difference of 0.24%).
| Demographics | Rating | Rank | 4 or more Vehicles in Household |
| Poles | 56.9 /100 | #167 | Average 6.4% |
| Lebanese | 55.8 /100 | #168 | Average 6.4% |
| Estonians | 55.1 /100 | #169 | Average 6.4% |
| Immigrants | Syria | 52.8 /100 | #170 | Average 6.3% |
| Immigrants | India | 51.9 /100 | #171 | Average 6.3% |
| Immigrants | Lebanon | 51.7 /100 | #172 | Average 6.3% |
| Slovenes | 51.1 /100 | #173 | Average 6.3% |
| Lithuanians | 50.0 /100 | #174 | Average 6.3% |
| Immigrants | Western Europe | 48.8 /100 | #175 | Average 6.3% |
| Ukrainians | 47.6 /100 | #176 | Average 6.3% |
| Slovaks | 46.9 /100 | #177 | Average 6.3% |
| Belizeans | 44.5 /100 | #178 | Average 6.3% |
| Immigrants | Japan | 43.1 /100 | #179 | Average 6.3% |
| Syrians | 42.0 /100 | #180 | Average 6.3% |
| Yugoslavians | 41.1 /100 | #181 | Average 6.3% |
Demographics Similar to Immigrants from Dominica by 4 or more Vehicles in Household
In terms of 4 or more vehicles in household, the demographic groups most similar to Immigrants from Dominica are West Indian (4.2%, a difference of 0.90%), Immigrants from Ecuador (4.2%, a difference of 1.2%), Immigrants from Senegal (4.2%, a difference of 1.4%), Trinidadian and Tobagonian (4.3%, a difference of 1.6%), and Immigrants from Albania (4.1%, a difference of 1.7%).
| Demographics | Rating | Rank | 4 or more Vehicles in Household |
| Immigrants | Jamaica | 0.0 /100 | #325 | Tragic 4.4% |
| Cape Verdeans | 0.0 /100 | #326 | Tragic 4.4% |
| Senegalese | 0.0 /100 | #327 | Tragic 4.3% |
| Trinidadians and Tobagonians | 0.0 /100 | #328 | Tragic 4.3% |
| Immigrants | Senegal | 0.0 /100 | #329 | Tragic 4.2% |
| Immigrants | Ecuador | 0.0 /100 | #330 | Tragic 4.2% |
| West Indians | 0.0 /100 | #331 | Tragic 4.2% |
| Immigrants | Dominica | 0.0 /100 | #332 | Tragic 4.2% |
| Immigrants | Albania | 0.0 /100 | #333 | Tragic 4.1% |
| Immigrants | Trinidad and Tobago | 0.0 /100 | #334 | Tragic 4.1% |
| Barbadians | 0.0 /100 | #335 | Tragic 3.9% |
| Immigrants | Bangladesh | 0.0 /100 | #336 | Tragic 3.9% |
| Vietnamese | 0.0 /100 | #337 | Tragic 3.9% |
| Immigrants | Cabo Verde | 0.0 /100 | #338 | Tragic 3.8% |
| Immigrants | Uzbekistan | 0.0 /100 | #339 | Tragic 3.6% |