Lithuanian vs Eastern European 4 or more Vehicles in Household
COMPARE
Lithuanian
Eastern European
4 or more Vehicles in Household
4 or more Vehicles in Household Comparison
Lithuanians
Eastern Europeans
6.3%
4 OR MORE VEHICLES IN HOUSEHOLD
50.0/ 100
METRIC RATING
174th/ 347
METRIC RANK
5.9%
4 OR MORE VEHICLES IN HOUSEHOLD
6.8/ 100
METRIC RATING
229th/ 347
METRIC RANK
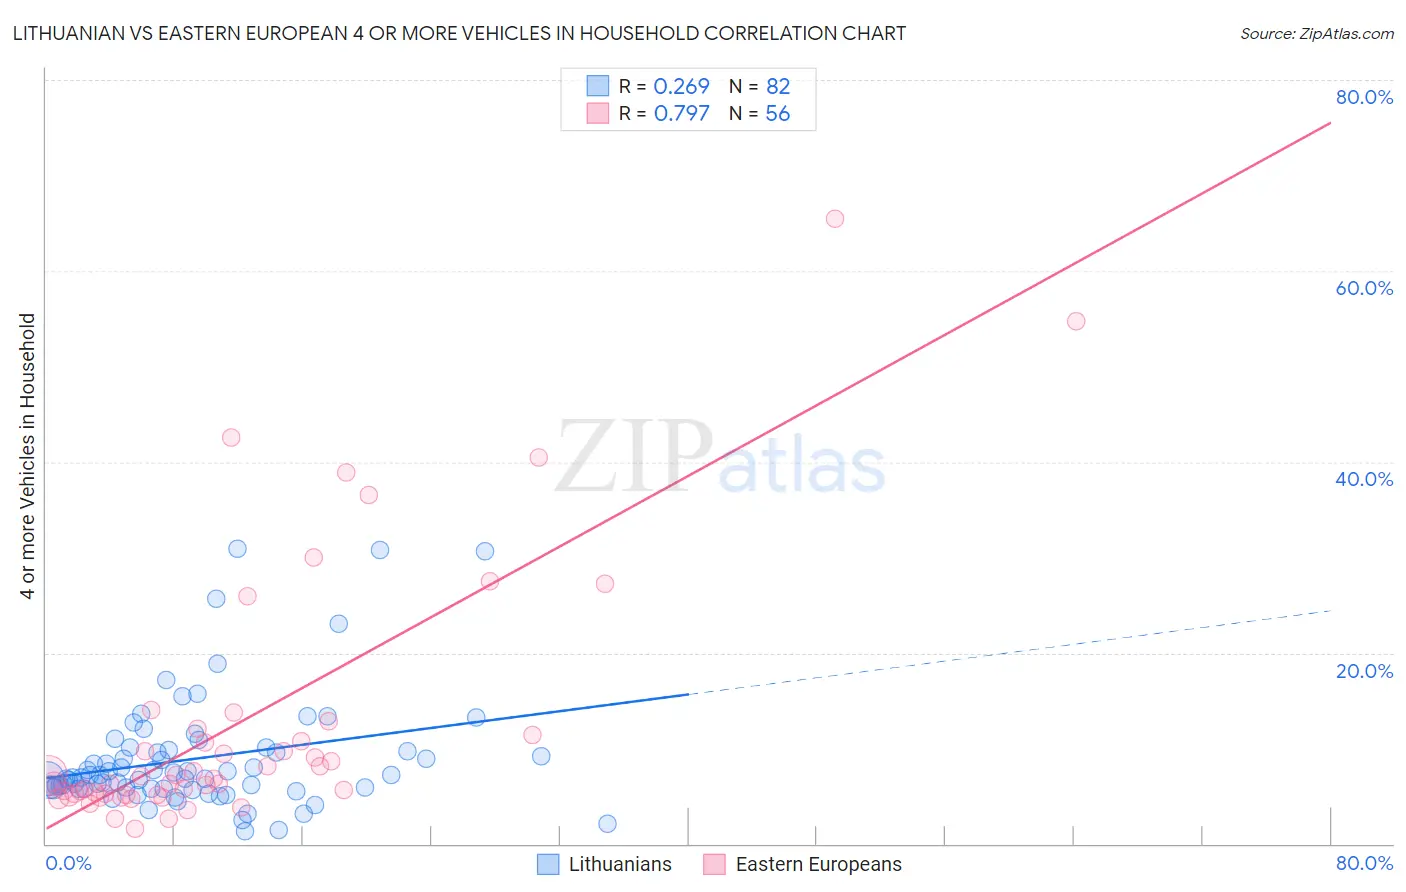
Lithuanian vs Eastern European 4 or more Vehicles in Household Correlation Chart
The statistical analysis conducted on geographies consisting of 420,091,012 people shows a weak positive correlation between the proportion of Lithuanians and percentage of households with 4 or more vehicles available in the United States with a correlation coefficient (R) of 0.269 and weighted average of 6.3%. Similarly, the statistical analysis conducted on geographies consisting of 459,039,876 people shows a strong positive correlation between the proportion of Eastern Europeans and percentage of households with 4 or more vehicles available in the United States with a correlation coefficient (R) of 0.797 and weighted average of 5.9%, a difference of 7.1%.
4 or more Vehicles in Household Correlation Summary
| Measurement | Lithuanian | Eastern European |
| Minimum | 1.3% | 1.6% |
| Maximum | 30.8% | 65.5% |
| Range | 29.6% | 63.9% |
| Mean | 8.9% | 12.6% |
| Median | 7.1% | 7.0% |
| Interquartile 25% (IQ1) | 5.8% | 5.2% |
| Interquartile 75% (IQ3) | 9.8% | 11.7% |
| Interquartile Range (IQR) | 4.1% | 6.5% |
| Standard Deviation (Sample) | 6.0% | 13.7% |
| Standard Deviation (Population) | 6.0% | 13.6% |
Similar Demographics by 4 or more Vehicles in Household
Demographics Similar to Lithuanians by 4 or more Vehicles in Household
In terms of 4 or more vehicles in household, the demographic groups most similar to Lithuanians are Slovene (6.3%, a difference of 0.12%), Immigrants from Western Europe (6.3%, a difference of 0.12%), Immigrants from Lebanon (6.3%, a difference of 0.17%), Immigrants from India (6.3%, a difference of 0.20%), and Ukrainian (6.3%, a difference of 0.24%).
| Demographics | Rating | Rank | 4 or more Vehicles in Household |
| Poles | 56.9 /100 | #167 | Average 6.4% |
| Lebanese | 55.8 /100 | #168 | Average 6.4% |
| Estonians | 55.1 /100 | #169 | Average 6.4% |
| Immigrants | Syria | 52.8 /100 | #170 | Average 6.3% |
| Immigrants | India | 51.9 /100 | #171 | Average 6.3% |
| Immigrants | Lebanon | 51.7 /100 | #172 | Average 6.3% |
| Slovenes | 51.1 /100 | #173 | Average 6.3% |
| Lithuanians | 50.0 /100 | #174 | Average 6.3% |
| Immigrants | Western Europe | 48.8 /100 | #175 | Average 6.3% |
| Ukrainians | 47.6 /100 | #176 | Average 6.3% |
| Slovaks | 46.9 /100 | #177 | Average 6.3% |
| Belizeans | 44.5 /100 | #178 | Average 6.3% |
| Immigrants | Japan | 43.1 /100 | #179 | Average 6.3% |
| Syrians | 42.0 /100 | #180 | Average 6.3% |
| Yugoslavians | 41.1 /100 | #181 | Average 6.3% |
Demographics Similar to Eastern Europeans by 4 or more Vehicles in Household
In terms of 4 or more vehicles in household, the demographic groups most similar to Eastern Europeans are Immigrants from Malaysia (5.9%, a difference of 0.070%), Immigrants from Switzerland (5.9%, a difference of 0.18%), Immigrants from Uganda (5.9%, a difference of 0.28%), Immigrants from Argentina (5.9%, a difference of 0.37%), and Immigrants from Western Asia (5.9%, a difference of 0.38%).
| Demographics | Rating | Rank | 4 or more Vehicles in Household |
| Cajuns | 9.2 /100 | #222 | Tragic 6.0% |
| Immigrants | Kenya | 9.2 /100 | #223 | Tragic 6.0% |
| Cubans | 9.2 /100 | #224 | Tragic 6.0% |
| Indonesians | 8.9 /100 | #225 | Tragic 6.0% |
| Immigrants | Singapore | 7.9 /100 | #226 | Tragic 5.9% |
| Immigrants | Western Asia | 7.8 /100 | #227 | Tragic 5.9% |
| Immigrants | Uganda | 7.5 /100 | #228 | Tragic 5.9% |
| Eastern Europeans | 6.8 /100 | #229 | Tragic 5.9% |
| Immigrants | Malaysia | 6.7 /100 | #230 | Tragic 5.9% |
| Immigrants | Switzerland | 6.4 /100 | #231 | Tragic 5.9% |
| Immigrants | Argentina | 6.0 /100 | #232 | Tragic 5.9% |
| Sierra Leoneans | 6.0 /100 | #233 | Tragic 5.9% |
| Africans | 4.6 /100 | #234 | Tragic 5.8% |
| Immigrants | Hungary | 4.6 /100 | #235 | Tragic 5.8% |
| Immigrants | Eritrea | 4.5 /100 | #236 | Tragic 5.8% |