Latvian vs Yuman 2 or more Vehicles in Household
COMPARE
Latvian
Yuman
2 or more Vehicles in Household
2 or more Vehicles in Household Comparison
Latvians
Yuman
56.2%
2 OR MORE VEHICLES IN HOUSEHOLD
83.6/ 100
METRIC RATING
140th/ 347
METRIC RANK
51.7%
2 OR MORE VEHICLES IN HOUSEHOLD
0.1/ 100
METRIC RATING
278th/ 347
METRIC RANK
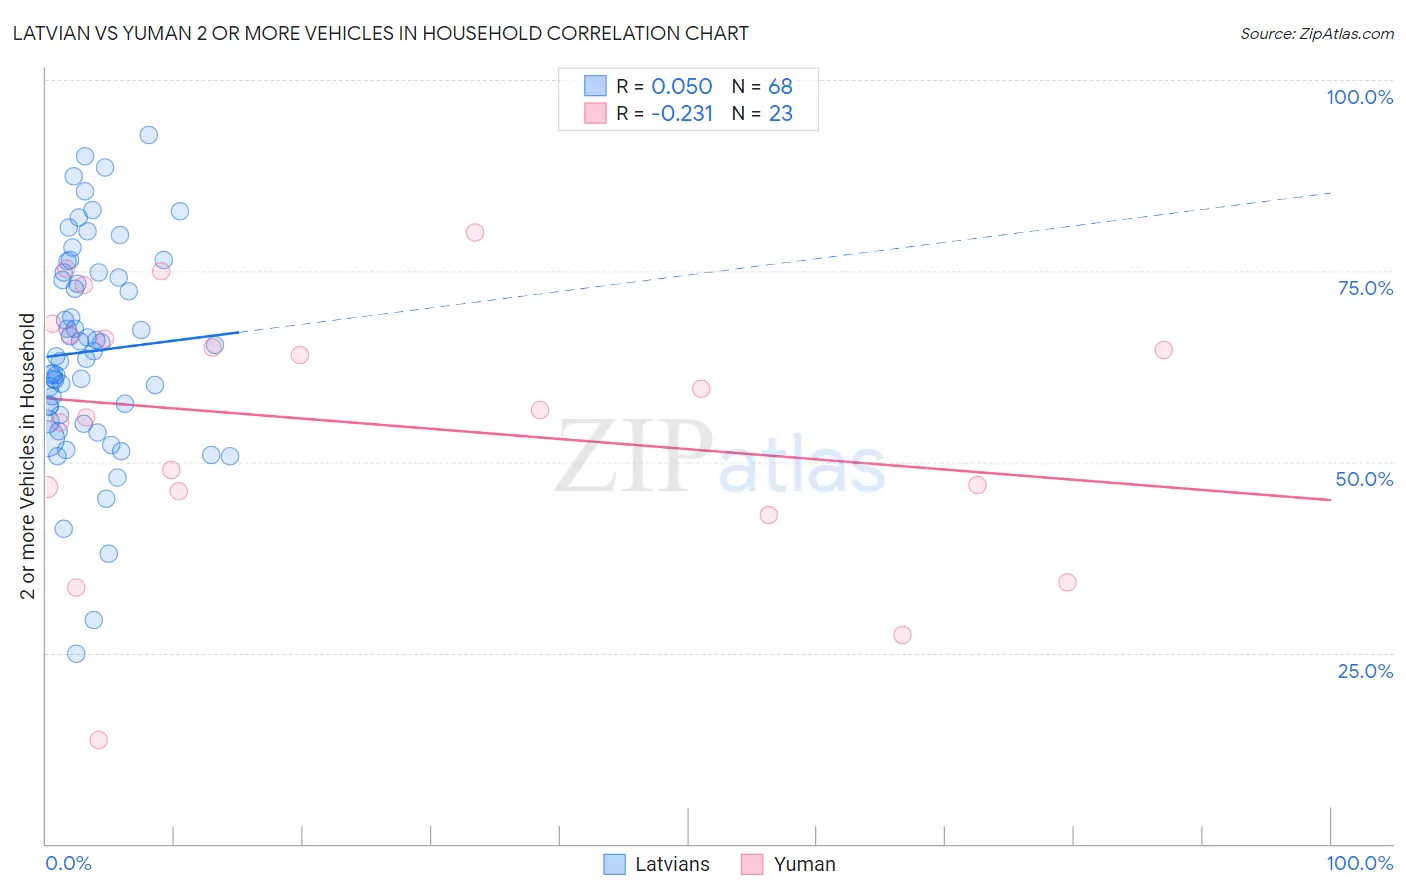
Latvian vs Yuman 2 or more Vehicles in Household Correlation Chart
The statistical analysis conducted on geographies consisting of 220,663,993 people shows no correlation between the proportion of Latvians and percentage of households with 2 or more vehicles available in the United States with a correlation coefficient (R) of 0.050 and weighted average of 56.2%. Similarly, the statistical analysis conducted on geographies consisting of 40,663,643 people shows a weak negative correlation between the proportion of Yuman and percentage of households with 2 or more vehicles available in the United States with a correlation coefficient (R) of -0.231 and weighted average of 51.7%, a difference of 8.7%.
2 or more Vehicles in Household Correlation Summary
| Measurement | Latvian | Yuman |
| Minimum | 24.9% | 13.6% |
| Maximum | 92.8% | 80.0% |
| Range | 67.9% | 66.4% |
| Mean | 64.5% | 55.0% |
| Median | 64.1% | 56.8% |
| Interquartile 25% (IQ1) | 55.7% | 46.1% |
| Interquartile 75% (IQ3) | 74.4% | 66.6% |
| Interquartile Range (IQR) | 18.7% | 20.5% |
| Standard Deviation (Sample) | 13.8% | 16.9% |
| Standard Deviation (Population) | 13.7% | 16.5% |
Similar Demographics by 2 or more Vehicles in Household
Demographics Similar to Latvians by 2 or more Vehicles in Household
In terms of 2 or more vehicles in household, the demographic groups most similar to Latvians are Immigrants from Cambodia (56.2%, a difference of 0.0%), South African (56.2%, a difference of 0.040%), Armenian (56.3%, a difference of 0.050%), Salvadoran (56.3%, a difference of 0.080%), and Cuban (56.3%, a difference of 0.090%).
| Demographics | Rating | Rank | 2 or more Vehicles in Household |
| Comanche | 88.4 /100 | #133 | Excellent 56.5% |
| Immigrants | Azores | 86.6 /100 | #134 | Excellent 56.4% |
| Blackfeet | 86.5 /100 | #135 | Excellent 56.4% |
| Immigrants | Asia | 86.0 /100 | #136 | Excellent 56.3% |
| Cubans | 84.8 /100 | #137 | Excellent 56.3% |
| Salvadorans | 84.7 /100 | #138 | Excellent 56.3% |
| Armenians | 84.3 /100 | #139 | Excellent 56.3% |
| Latvians | 83.6 /100 | #140 | Excellent 56.2% |
| Immigrants | Cambodia | 83.6 /100 | #141 | Excellent 56.2% |
| South Africans | 83.1 /100 | #142 | Excellent 56.2% |
| Seminole | 81.7 /100 | #143 | Excellent 56.2% |
| Immigrants | Syria | 81.4 /100 | #144 | Excellent 56.2% |
| Syrians | 81.2 /100 | #145 | Excellent 56.2% |
| Venezuelans | 80.7 /100 | #146 | Excellent 56.1% |
| Serbians | 80.3 /100 | #147 | Excellent 56.1% |
Demographics Similar to Yuman by 2 or more Vehicles in Household
In terms of 2 or more vehicles in household, the demographic groups most similar to Yuman are Liberian (51.7%, a difference of 0.010%), Immigrants from Eastern Europe (51.7%, a difference of 0.040%), Immigrants from Africa (51.8%, a difference of 0.060%), Immigrants from Croatia (51.8%, a difference of 0.12%), and Immigrants from Honduras (51.8%, a difference of 0.14%).
| Demographics | Rating | Rank | 2 or more Vehicles in Household |
| South Americans | 0.2 /100 | #271 | Tragic 51.9% |
| Sub-Saharan Africans | 0.2 /100 | #272 | Tragic 51.9% |
| Israelis | 0.2 /100 | #273 | Tragic 51.9% |
| Africans | 0.2 /100 | #274 | Tragic 51.8% |
| Immigrants | Honduras | 0.2 /100 | #275 | Tragic 51.8% |
| Immigrants | Croatia | 0.2 /100 | #276 | Tragic 51.8% |
| Immigrants | Africa | 0.2 /100 | #277 | Tragic 51.8% |
| Yuman | 0.1 /100 | #278 | Tragic 51.7% |
| Liberians | 0.1 /100 | #279 | Tragic 51.7% |
| Immigrants | Eastern Europe | 0.1 /100 | #280 | Tragic 51.7% |
| Immigrants | Kazakhstan | 0.1 /100 | #281 | Tragic 51.6% |
| Bahamians | 0.1 /100 | #282 | Tragic 51.5% |
| Immigrants | China | 0.1 /100 | #283 | Tragic 51.5% |
| Immigrants | Zaire | 0.1 /100 | #284 | Tragic 51.5% |
| Immigrants | Uruguay | 0.1 /100 | #285 | Tragic 51.4% |