Latvian vs Yuman College, Under 1 year
COMPARE
Latvian
Yuman
College, Under 1 year
College, Under 1 year Comparison
Latvians
Yuman
71.6%
COLLEGE, UNDER 1 YEAR
100.0/ 100
METRIC RATING
19th/ 347
METRIC RANK
55.1%
COLLEGE, UNDER 1 YEAR
0.0/ 100
METRIC RATING
333rd/ 347
METRIC RANK
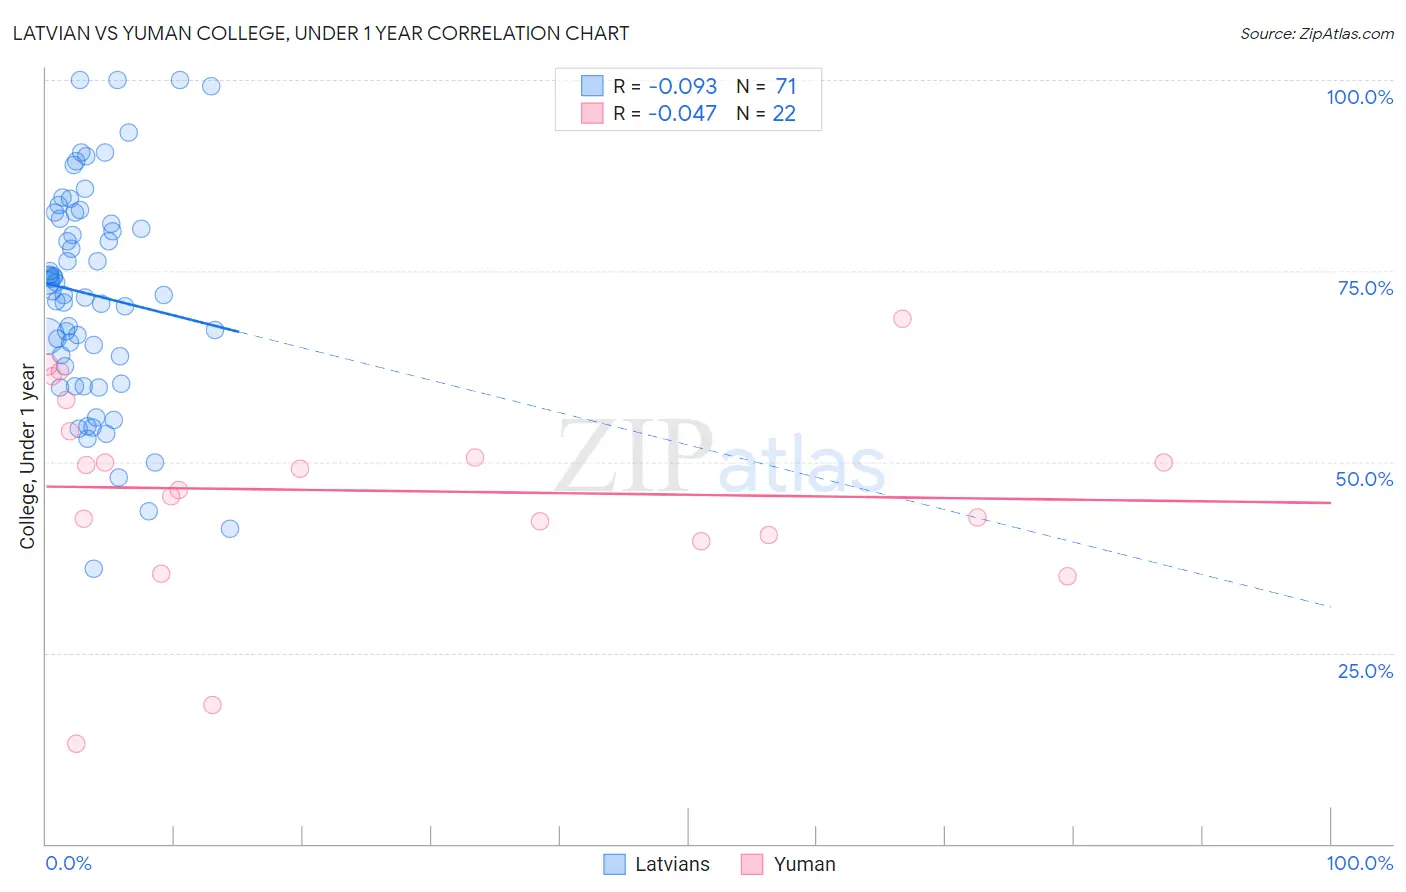
Latvian vs Yuman College, Under 1 year Correlation Chart
The statistical analysis conducted on geographies consisting of 220,726,880 people shows a slight negative correlation between the proportion of Latvians and percentage of population with at least college, under 1 year education in the United States with a correlation coefficient (R) of -0.093 and weighted average of 71.6%. Similarly, the statistical analysis conducted on geographies consisting of 40,696,202 people shows no correlation between the proportion of Yuman and percentage of population with at least college, under 1 year education in the United States with a correlation coefficient (R) of -0.047 and weighted average of 55.1%, a difference of 30.0%.
College, Under 1 year Correlation Summary
| Measurement | Latvian | Yuman |
| Minimum | 36.0% | 13.1% |
| Maximum | 100.0% | 68.8% |
| Range | 64.0% | 55.7% |
| Mean | 71.9% | 46.2% |
| Median | 72.3% | 47.7% |
| Interquartile 25% (IQ1) | 62.5% | 40.4% |
| Interquartile 75% (IQ3) | 81.9% | 54.0% |
| Interquartile Range (IQR) | 19.4% | 13.5% |
| Standard Deviation (Sample) | 14.2% | 13.4% |
| Standard Deviation (Population) | 14.1% | 13.1% |
Similar Demographics by College, Under 1 year
Demographics Similar to Latvians by College, Under 1 year
In terms of college, under 1 year, the demographic groups most similar to Latvians are Immigrants from Korea (71.6%, a difference of 0.040%), Immigrants from Switzerland (71.7%, a difference of 0.11%), Immigrants from Belgium (71.5%, a difference of 0.19%), Eastern European (71.8%, a difference of 0.24%), and Immigrants from Japan (71.9%, a difference of 0.39%).
| Demographics | Rating | Rank | College, Under 1 year |
| Immigrants | Sweden | 100.0 /100 | #12 | Exceptional 72.1% |
| Cypriots | 100.0 /100 | #13 | Exceptional 72.0% |
| Cambodians | 100.0 /100 | #14 | Exceptional 71.9% |
| Burmese | 100.0 /100 | #15 | Exceptional 71.9% |
| Immigrants | Japan | 100.0 /100 | #16 | Exceptional 71.9% |
| Eastern Europeans | 100.0 /100 | #17 | Exceptional 71.8% |
| Immigrants | Switzerland | 100.0 /100 | #18 | Exceptional 71.7% |
| Latvians | 100.0 /100 | #19 | Exceptional 71.6% |
| Immigrants | Korea | 100.0 /100 | #20 | Exceptional 71.6% |
| Immigrants | Belgium | 100.0 /100 | #21 | Exceptional 71.5% |
| Immigrants | Eastern Asia | 100.0 /100 | #22 | Exceptional 71.3% |
| Immigrants | Northern Europe | 100.0 /100 | #23 | Exceptional 71.1% |
| Soviet Union | 100.0 /100 | #24 | Exceptional 71.1% |
| Bulgarians | 100.0 /100 | #25 | Exceptional 71.1% |
| Immigrants | Denmark | 100.0 /100 | #26 | Exceptional 71.0% |
Demographics Similar to Yuman by College, Under 1 year
In terms of college, under 1 year, the demographic groups most similar to Yuman are Immigrants from Yemen (55.3%, a difference of 0.32%), Immigrants from the Azores (54.7%, a difference of 0.72%), Dominican (55.5%, a difference of 0.73%), Inupiat (54.6%, a difference of 0.85%), and Mexican (55.6%, a difference of 0.99%).
| Demographics | Rating | Rank | College, Under 1 year |
| Navajo | 0.0 /100 | #326 | Tragic 56.3% |
| Immigrants | Guatemala | 0.0 /100 | #327 | Tragic 56.2% |
| Cape Verdeans | 0.0 /100 | #328 | Tragic 56.0% |
| Immigrants | Cuba | 0.0 /100 | #329 | Tragic 55.7% |
| Mexicans | 0.0 /100 | #330 | Tragic 55.6% |
| Dominicans | 0.0 /100 | #331 | Tragic 55.5% |
| Immigrants | Yemen | 0.0 /100 | #332 | Tragic 55.3% |
| Yuman | 0.0 /100 | #333 | Tragic 55.1% |
| Immigrants | Azores | 0.0 /100 | #334 | Tragic 54.7% |
| Inupiat | 0.0 /100 | #335 | Tragic 54.6% |
| Pennsylvania Germans | 0.0 /100 | #336 | Tragic 54.5% |
| Immigrants | Central America | 0.0 /100 | #337 | Tragic 54.4% |
| Lumbee | 0.0 /100 | #338 | Tragic 54.2% |
| Immigrants | Dominican Republic | 0.0 /100 | #339 | Tragic 54.0% |
| Spanish American Indians | 0.0 /100 | #340 | Tragic 54.0% |