Danish vs Pima 1 or more Vehicles in Household
COMPARE
Danish
Pima
1 or more Vehicles in Household
1 or more Vehicles in Household Comparison
Danes
Pima
93.5%
1 OR MORE VEHICLES IN HOUSEHOLD
100.0/ 100
METRIC RATING
6th/ 347
METRIC RANK
86.3%
1 OR MORE VEHICLES IN HOUSEHOLD
0.0/ 100
METRIC RATING
291st/ 347
METRIC RANK
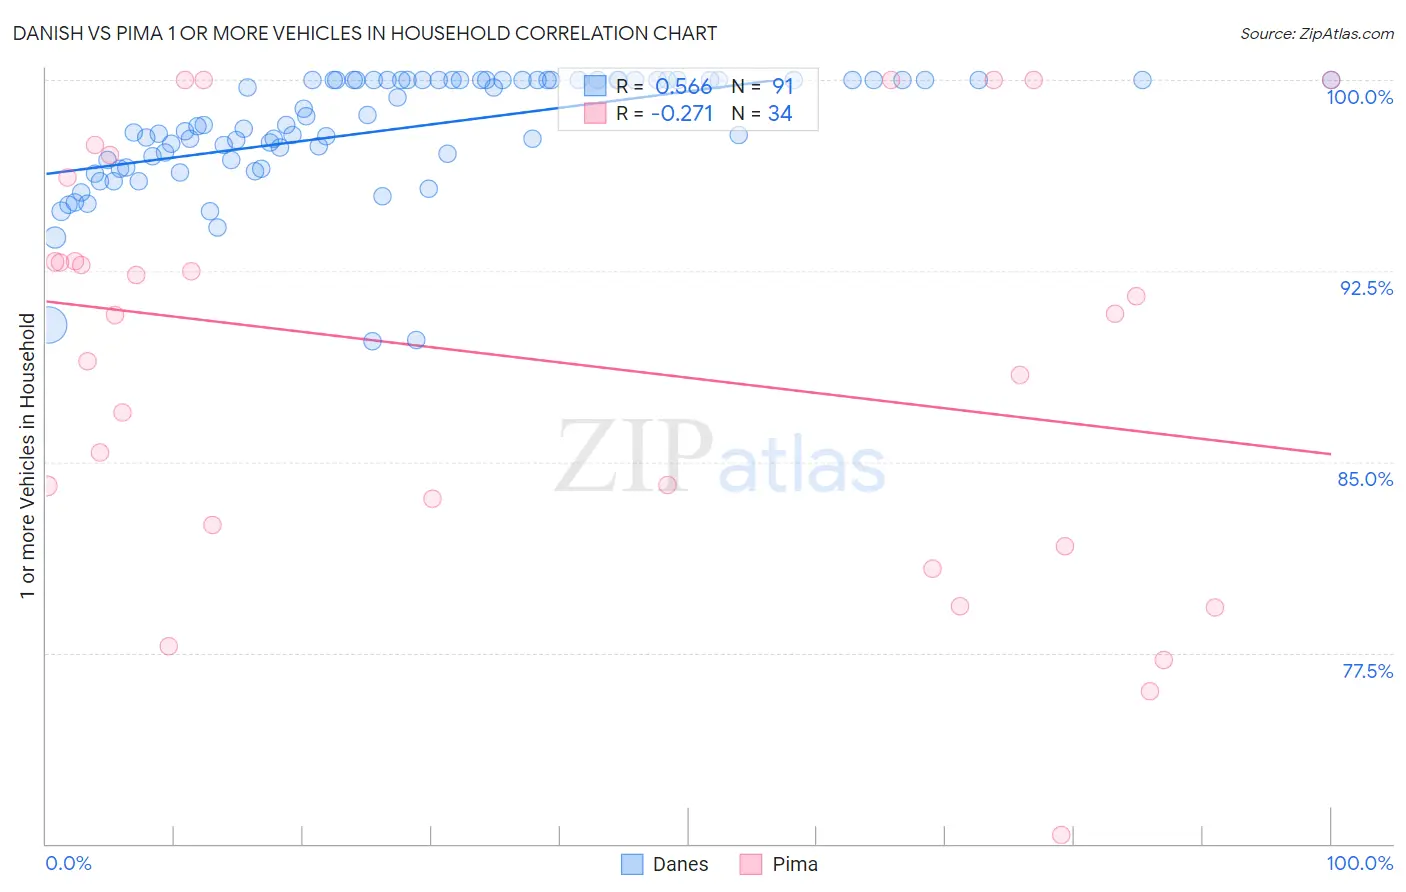
Danish vs Pima 1 or more Vehicles in Household Correlation Chart
The statistical analysis conducted on geographies consisting of 473,956,098 people shows a substantial positive correlation between the proportion of Danes and percentage of households with 1 or more vehicles available in the United States with a correlation coefficient (R) of 0.566 and weighted average of 93.5%. Similarly, the statistical analysis conducted on geographies consisting of 61,539,566 people shows a weak negative correlation between the proportion of Pima and percentage of households with 1 or more vehicles available in the United States with a correlation coefficient (R) of -0.271 and weighted average of 86.3%, a difference of 8.4%.
1 or more Vehicles in Household Correlation Summary
| Measurement | Danish | Pima |
| Minimum | 89.7% | 70.4% |
| Maximum | 100.0% | 100.0% |
| Range | 10.3% | 29.6% |
| Mean | 98.0% | 89.0% |
| Median | 98.2% | 90.8% |
| Interquartile 25% (IQ1) | 96.9% | 82.5% |
| Interquartile 75% (IQ3) | 100.0% | 96.2% |
| Interquartile Range (IQR) | 3.1% | 13.6% |
| Standard Deviation (Sample) | 2.3% | 8.2% |
| Standard Deviation (Population) | 2.3% | 8.1% |
Similar Demographics by 1 or more Vehicles in Household
Demographics Similar to Danes by 1 or more Vehicles in Household
In terms of 1 or more vehicles in household, the demographic groups most similar to Danes are Yakama (93.6%, a difference of 0.020%), German (93.6%, a difference of 0.12%), Norwegian (93.7%, a difference of 0.16%), Scottish (93.4%, a difference of 0.19%), and Swedish (93.3%, a difference of 0.23%).
| Demographics | Rating | Rank | 1 or more Vehicles in Household |
| Luxembourgers | 100.0 /100 | #1 | Exceptional 94.8% |
| English | 100.0 /100 | #2 | Exceptional 93.8% |
| Norwegians | 100.0 /100 | #3 | Exceptional 93.7% |
| Germans | 100.0 /100 | #4 | Exceptional 93.6% |
| Yakama | 100.0 /100 | #5 | Exceptional 93.6% |
| Danes | 100.0 /100 | #6 | Exceptional 93.5% |
| Scottish | 100.0 /100 | #7 | Exceptional 93.4% |
| Swedes | 100.0 /100 | #8 | Exceptional 93.3% |
| Scotch-Irish | 100.0 /100 | #9 | Exceptional 93.3% |
| Dutch | 100.0 /100 | #10 | Exceptional 93.3% |
| Czechs | 100.0 /100 | #11 | Exceptional 93.3% |
| Scandinavians | 100.0 /100 | #12 | Exceptional 93.1% |
| Whites/Caucasians | 100.0 /100 | #13 | Exceptional 93.1% |
| Irish | 100.0 /100 | #14 | Exceptional 93.1% |
| Mexicans | 100.0 /100 | #15 | Exceptional 93.0% |
Demographics Similar to Pima by 1 or more Vehicles in Household
In terms of 1 or more vehicles in household, the demographic groups most similar to Pima are Immigrants from Australia (86.4%, a difference of 0.080%), Immigrants from Ireland (86.4%, a difference of 0.12%), Hopi (86.4%, a difference of 0.14%), Immigrants from Malaysia (86.5%, a difference of 0.21%), and Okinawan (86.1%, a difference of 0.23%).
| Demographics | Rating | Rank | 1 or more Vehicles in Household |
| Central American Indians | 0.0 /100 | #284 | Tragic 86.7% |
| Immigrants | Kazakhstan | 0.0 /100 | #285 | Tragic 86.6% |
| Immigrants | Eastern Asia | 0.0 /100 | #286 | Tragic 86.5% |
| Immigrants | Malaysia | 0.0 /100 | #287 | Tragic 86.5% |
| Hopi | 0.0 /100 | #288 | Tragic 86.4% |
| Immigrants | Ireland | 0.0 /100 | #289 | Tragic 86.4% |
| Immigrants | Australia | 0.0 /100 | #290 | Tragic 86.4% |
| Pima | 0.0 /100 | #291 | Tragic 86.3% |
| Okinawans | 0.0 /100 | #292 | Tragic 86.1% |
| Indians (Asian) | 0.0 /100 | #293 | Tragic 86.0% |
| Alaskan Athabascans | 0.0 /100 | #294 | Tragic 86.0% |
| Immigrants | Jamaica | 0.0 /100 | #295 | Tragic 85.8% |
| Immigrants | Spain | 0.0 /100 | #296 | Tragic 85.8% |
| Paraguayans | 0.0 /100 | #297 | Tragic 85.7% |
| Belizeans | 0.0 /100 | #298 | Tragic 85.7% |