Kiowa vs Nigerian 1 or more Vehicles in Household
COMPARE
Kiowa
Nigerian
1 or more Vehicles in Household
1 or more Vehicles in Household Comparison
Kiowa
Nigerians
88.6%
1 OR MORE VEHICLES IN HOUSEHOLD
3.8/ 100
METRIC RATING
239th/ 347
METRIC RANK
88.0%
1 OR MORE VEHICLES IN HOUSEHOLD
0.8/ 100
METRIC RATING
259th/ 347
METRIC RANK
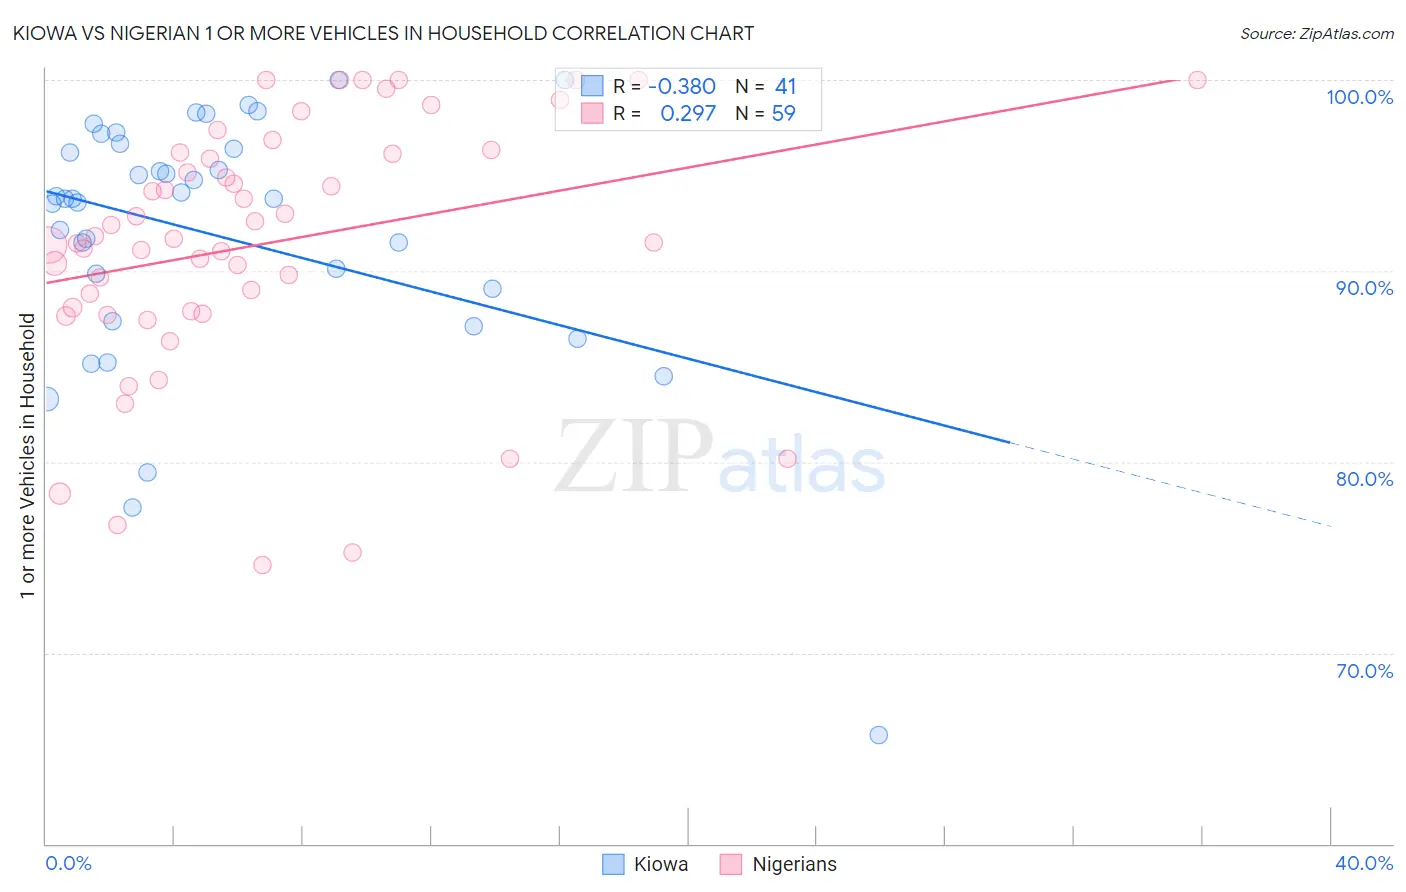
Kiowa vs Nigerian 1 or more Vehicles in Household Correlation Chart
The statistical analysis conducted on geographies consisting of 56,099,396 people shows a mild negative correlation between the proportion of Kiowa and percentage of households with 1 or more vehicles available in the United States with a correlation coefficient (R) of -0.380 and weighted average of 88.6%. Similarly, the statistical analysis conducted on geographies consisting of 332,510,990 people shows a weak positive correlation between the proportion of Nigerians and percentage of households with 1 or more vehicles available in the United States with a correlation coefficient (R) of 0.297 and weighted average of 88.0%, a difference of 0.63%.
1 or more Vehicles in Household Correlation Summary
| Measurement | Kiowa | Nigerian |
| Minimum | 65.7% | 74.6% |
| Maximum | 100.0% | 100.0% |
| Range | 34.3% | 25.4% |
| Mean | 91.8% | 91.4% |
| Median | 93.8% | 91.7% |
| Interquartile 25% (IQ1) | 88.2% | 87.9% |
| Interquartile 75% (IQ3) | 96.6% | 96.2% |
| Interquartile Range (IQR) | 8.4% | 8.3% |
| Standard Deviation (Sample) | 6.9% | 6.5% |
| Standard Deviation (Population) | 6.8% | 6.5% |
Demographics Similar to Kiowa and Nigerians by 1 or more Vehicles in Household
In terms of 1 or more vehicles in household, the demographic groups most similar to Kiowa are Eastern European (88.5%, a difference of 0.10%), Taiwanese (88.4%, a difference of 0.15%), Turkish (88.4%, a difference of 0.17%), Immigrants from Belgium (88.4%, a difference of 0.23%), and Immigrants from Portugal (88.3%, a difference of 0.25%). Similarly, the demographic groups most similar to Nigerians are Liberian (88.0%, a difference of 0.030%), South American Indian (88.0%, a difference of 0.030%), Immigrants from Latvia (88.1%, a difference of 0.040%), Colombian (88.0%, a difference of 0.040%), and Honduran (88.1%, a difference of 0.070%).
| Demographics | Rating | Rank | 1 or more Vehicles in Household |
| Kiowa | 3.8 /100 | #239 | Tragic 88.6% |
| Eastern Europeans | 3.0 /100 | #240 | Tragic 88.5% |
| Taiwanese | 2.6 /100 | #241 | Tragic 88.4% |
| Turks | 2.5 /100 | #242 | Tragic 88.4% |
| Immigrants | Belgium | 2.1 /100 | #243 | Tragic 88.4% |
| Immigrants | Portugal | 2.0 /100 | #244 | Tragic 88.3% |
| Immigrants | Czechoslovakia | 1.9 /100 | #245 | Tragic 88.3% |
| Menominee | 1.9 /100 | #246 | Tragic 88.3% |
| Immigrants | Honduras | 1.7 /100 | #247 | Tragic 88.3% |
| Immigrants | Nigeria | 1.5 /100 | #248 | Tragic 88.2% |
| Blacks/African Americans | 1.4 /100 | #249 | Tragic 88.2% |
| Egyptians | 1.2 /100 | #250 | Tragic 88.2% |
| Immigrants | Serbia | 1.2 /100 | #251 | Tragic 88.2% |
| Immigrants | Uruguay | 1.1 /100 | #252 | Tragic 88.1% |
| Hondurans | 1.0 /100 | #253 | Tragic 88.1% |
| Haitians | 0.9 /100 | #254 | Tragic 88.1% |
| Immigrants | Latvia | 0.9 /100 | #255 | Tragic 88.1% |
| Colombians | 0.9 /100 | #256 | Tragic 88.0% |
| Liberians | 0.9 /100 | #257 | Tragic 88.0% |
| South American Indians | 0.9 /100 | #258 | Tragic 88.0% |
| Nigerians | 0.8 /100 | #259 | Tragic 88.0% |