Kiowa vs Ecuadorian 1 or more Vehicles in Household
COMPARE
Kiowa
Ecuadorian
1 or more Vehicles in Household
1 or more Vehicles in Household Comparison
Kiowa
Ecuadorians
88.6%
1 OR MORE VEHICLES IN HOUSEHOLD
3.8/ 100
METRIC RATING
239th/ 347
METRIC RANK
77.9%
1 OR MORE VEHICLES IN HOUSEHOLD
0.0/ 100
METRIC RATING
328th/ 347
METRIC RANK
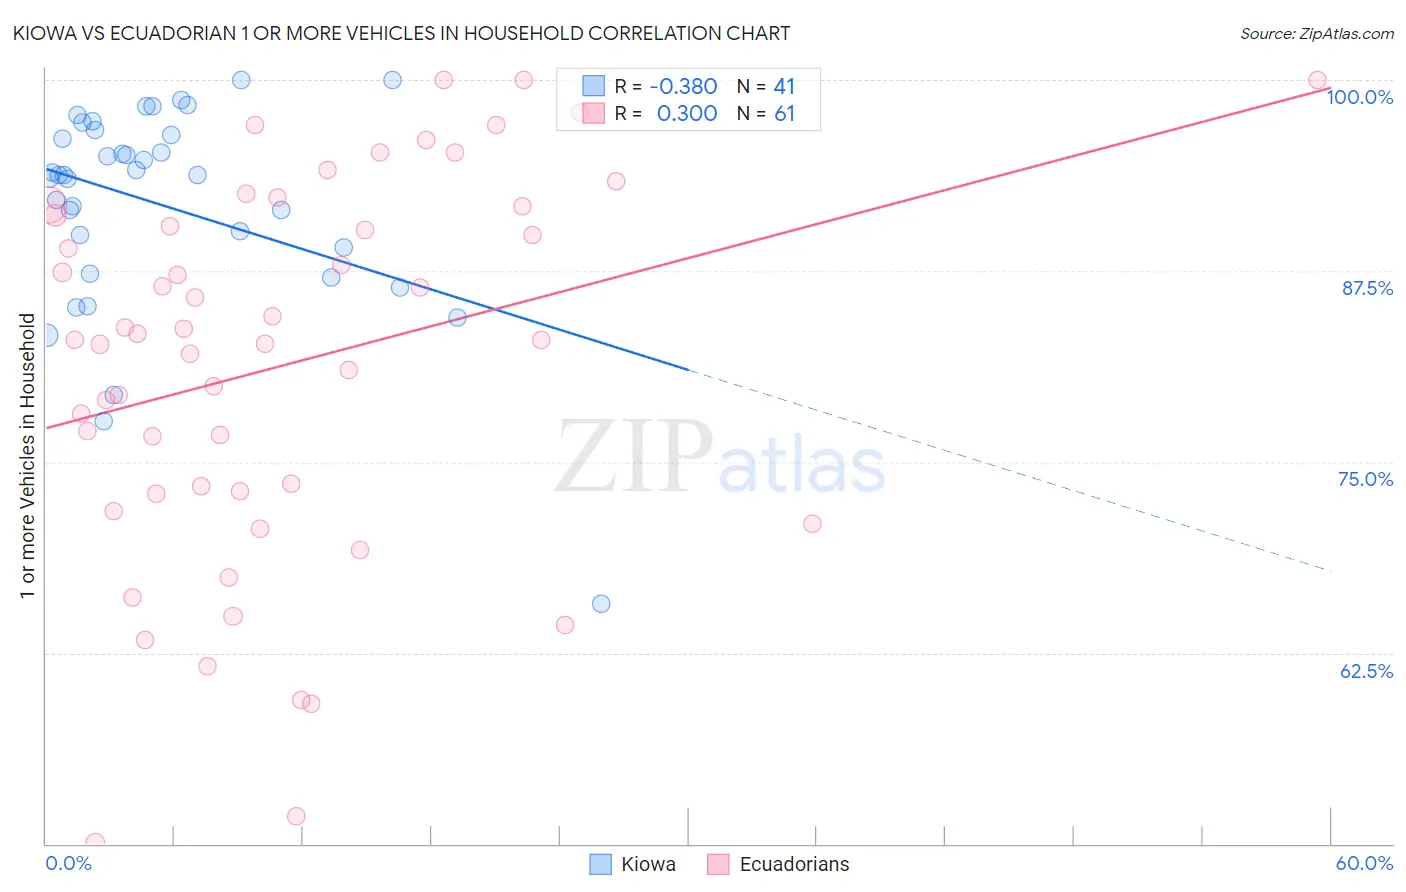
Kiowa vs Ecuadorian 1 or more Vehicles in Household Correlation Chart
The statistical analysis conducted on geographies consisting of 56,099,396 people shows a mild negative correlation between the proportion of Kiowa and percentage of households with 1 or more vehicles available in the United States with a correlation coefficient (R) of -0.380 and weighted average of 88.6%. Similarly, the statistical analysis conducted on geographies consisting of 317,563,927 people shows a mild positive correlation between the proportion of Ecuadorians and percentage of households with 1 or more vehicles available in the United States with a correlation coefficient (R) of 0.300 and weighted average of 77.9%, a difference of 13.6%.
1 or more Vehicles in Household Correlation Summary
| Measurement | Kiowa | Ecuadorian |
| Minimum | 65.7% | 50.1% |
| Maximum | 100.0% | 100.0% |
| Range | 34.3% | 49.9% |
| Mean | 91.8% | 81.4% |
| Median | 93.8% | 83.0% |
| Interquartile 25% (IQ1) | 88.2% | 73.0% |
| Interquartile 75% (IQ3) | 96.6% | 91.4% |
| Interquartile Range (IQR) | 8.4% | 18.4% |
| Standard Deviation (Sample) | 6.9% | 12.3% |
| Standard Deviation (Population) | 6.8% | 12.2% |
Similar Demographics by 1 or more Vehicles in Household
Demographics Similar to Kiowa by 1 or more Vehicles in Household
In terms of 1 or more vehicles in household, the demographic groups most similar to Kiowa are Immigrants from Somalia (88.6%, a difference of 0.040%), Immigrants from Turkey (88.6%, a difference of 0.060%), Immigrants from Pakistan (88.6%, a difference of 0.070%), Paiute (88.6%, a difference of 0.080%), and Immigrants from Peru (88.6%, a difference of 0.090%).
| Demographics | Rating | Rank | 1 or more Vehicles in Household |
| Immigrants | Japan | 4.9 /100 | #232 | Tragic 88.7% |
| Houma | 4.8 /100 | #233 | Tragic 88.6% |
| Immigrants | Peru | 4.7 /100 | #234 | Tragic 88.6% |
| Paiute | 4.6 /100 | #235 | Tragic 88.6% |
| Immigrants | Pakistan | 4.5 /100 | #236 | Tragic 88.6% |
| Immigrants | Turkey | 4.4 /100 | #237 | Tragic 88.6% |
| Immigrants | Somalia | 4.2 /100 | #238 | Tragic 88.6% |
| Kiowa | 3.8 /100 | #239 | Tragic 88.6% |
| Eastern Europeans | 3.0 /100 | #240 | Tragic 88.5% |
| Taiwanese | 2.6 /100 | #241 | Tragic 88.4% |
| Turks | 2.5 /100 | #242 | Tragic 88.4% |
| Immigrants | Belgium | 2.1 /100 | #243 | Tragic 88.4% |
| Immigrants | Portugal | 2.0 /100 | #244 | Tragic 88.3% |
| Immigrants | Czechoslovakia | 1.9 /100 | #245 | Tragic 88.3% |
| Menominee | 1.9 /100 | #246 | Tragic 88.3% |
Demographics Similar to Ecuadorians by 1 or more Vehicles in Household
In terms of 1 or more vehicles in household, the demographic groups most similar to Ecuadorians are Immigrants from Dominica (77.8%, a difference of 0.14%), Immigrants from Senegal (79.0%, a difference of 1.3%), Immigrants from Trinidad and Tobago (76.8%, a difference of 1.5%), Immigrants from West Indies (79.5%, a difference of 2.0%), and West Indian (76.4%, a difference of 2.1%).
| Demographics | Rating | Rank | 1 or more Vehicles in Household |
| Jamaicans | 0.0 /100 | #321 | Tragic 82.1% |
| Immigrants | Cabo Verde | 0.0 /100 | #322 | Tragic 81.6% |
| Immigrants | Yemen | 0.0 /100 | #323 | Tragic 80.5% |
| Immigrants | Caribbean | 0.0 /100 | #324 | Tragic 80.4% |
| Senegalese | 0.0 /100 | #325 | Tragic 80.4% |
| Immigrants | West Indies | 0.0 /100 | #326 | Tragic 79.5% |
| Immigrants | Senegal | 0.0 /100 | #327 | Tragic 79.0% |
| Ecuadorians | 0.0 /100 | #328 | Tragic 77.9% |
| Immigrants | Dominica | 0.0 /100 | #329 | Tragic 77.8% |
| Immigrants | Trinidad and Tobago | 0.0 /100 | #330 | Tragic 76.8% |
| West Indians | 0.0 /100 | #331 | Tragic 76.4% |
| Trinidadians and Tobagonians | 0.0 /100 | #332 | Tragic 76.3% |
| Immigrants | Ecuador | 0.0 /100 | #333 | Tragic 76.2% |
| Immigrants | Bangladesh | 0.0 /100 | #334 | Tragic 74.3% |
| Barbadians | 0.0 /100 | #335 | Tragic 74.0% |