Kiowa vs Slovene 1 or more Vehicles in Household
COMPARE
Kiowa
Slovene
1 or more Vehicles in Household
1 or more Vehicles in Household Comparison
Kiowa
Slovenes
88.6%
1 OR MORE VEHICLES IN HOUSEHOLD
3.8/ 100
METRIC RATING
239th/ 347
METRIC RANK
92.0%
1 OR MORE VEHICLES IN HOUSEHOLD
99.9/ 100
METRIC RATING
54th/ 347
METRIC RANK
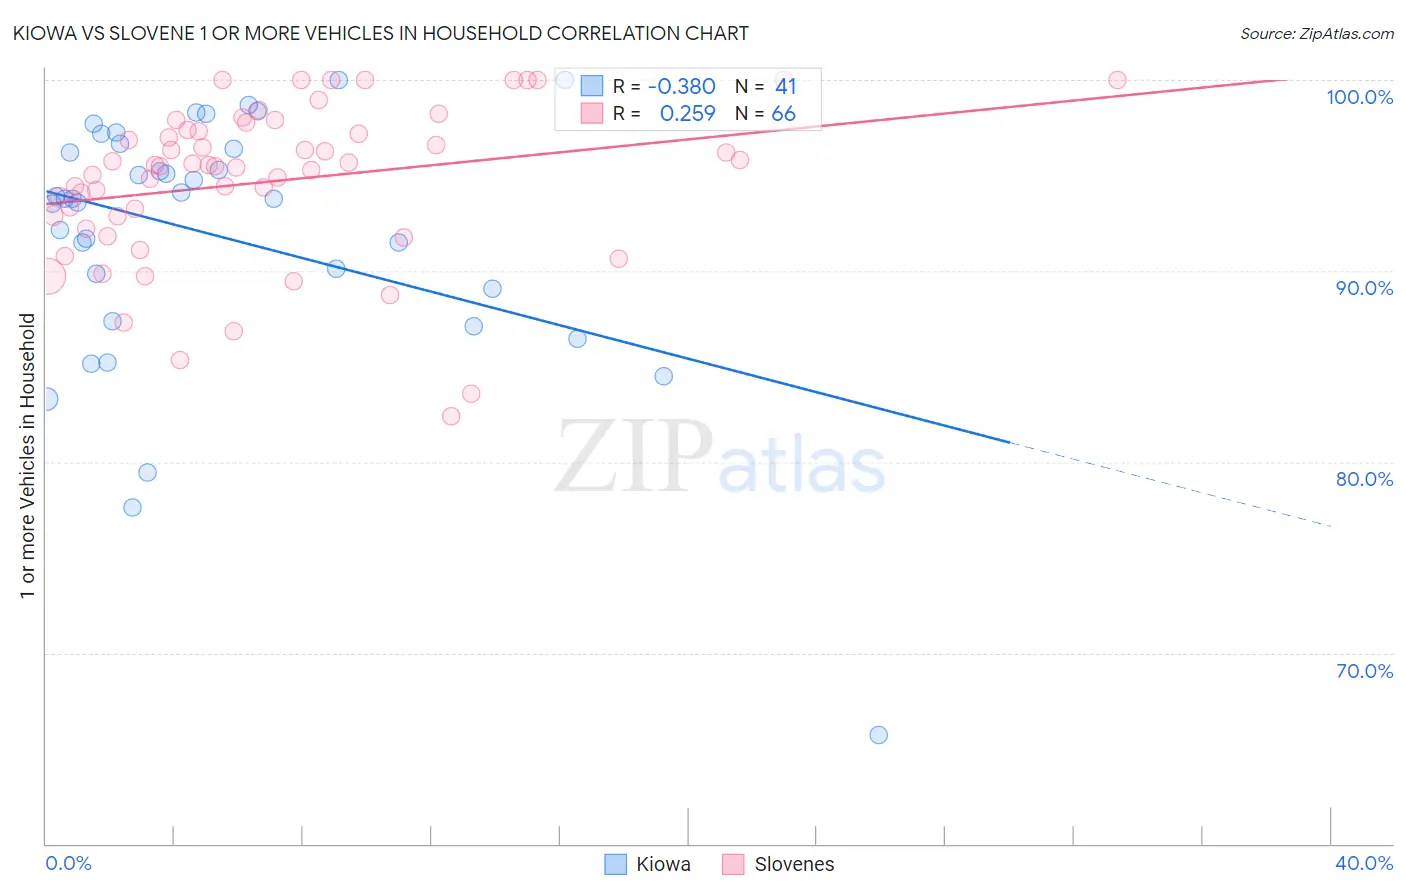
Kiowa vs Slovene 1 or more Vehicles in Household Correlation Chart
The statistical analysis conducted on geographies consisting of 56,099,396 people shows a mild negative correlation between the proportion of Kiowa and percentage of households with 1 or more vehicles available in the United States with a correlation coefficient (R) of -0.380 and weighted average of 88.6%. Similarly, the statistical analysis conducted on geographies consisting of 261,275,644 people shows a weak positive correlation between the proportion of Slovenes and percentage of households with 1 or more vehicles available in the United States with a correlation coefficient (R) of 0.259 and weighted average of 92.0%, a difference of 3.9%.
1 or more Vehicles in Household Correlation Summary
| Measurement | Kiowa | Slovene |
| Minimum | 65.7% | 82.4% |
| Maximum | 100.0% | 100.0% |
| Range | 34.3% | 17.6% |
| Mean | 91.8% | 94.7% |
| Median | 93.8% | 95.5% |
| Interquartile 25% (IQ1) | 88.2% | 92.8% |
| Interquartile 75% (IQ3) | 96.6% | 97.4% |
| Interquartile Range (IQR) | 8.4% | 4.5% |
| Standard Deviation (Sample) | 6.9% | 4.1% |
| Standard Deviation (Population) | 6.8% | 4.1% |
Similar Demographics by 1 or more Vehicles in Household
Demographics Similar to Kiowa by 1 or more Vehicles in Household
In terms of 1 or more vehicles in household, the demographic groups most similar to Kiowa are Immigrants from Somalia (88.6%, a difference of 0.040%), Immigrants from Turkey (88.6%, a difference of 0.060%), Immigrants from Pakistan (88.6%, a difference of 0.070%), Paiute (88.6%, a difference of 0.080%), and Immigrants from Peru (88.6%, a difference of 0.090%).
| Demographics | Rating | Rank | 1 or more Vehicles in Household |
| Immigrants | Japan | 4.9 /100 | #232 | Tragic 88.7% |
| Houma | 4.8 /100 | #233 | Tragic 88.6% |
| Immigrants | Peru | 4.7 /100 | #234 | Tragic 88.6% |
| Paiute | 4.6 /100 | #235 | Tragic 88.6% |
| Immigrants | Pakistan | 4.5 /100 | #236 | Tragic 88.6% |
| Immigrants | Turkey | 4.4 /100 | #237 | Tragic 88.6% |
| Immigrants | Somalia | 4.2 /100 | #238 | Tragic 88.6% |
| Kiowa | 3.8 /100 | #239 | Tragic 88.6% |
| Eastern Europeans | 3.0 /100 | #240 | Tragic 88.5% |
| Taiwanese | 2.6 /100 | #241 | Tragic 88.4% |
| Turks | 2.5 /100 | #242 | Tragic 88.4% |
| Immigrants | Belgium | 2.1 /100 | #243 | Tragic 88.4% |
| Immigrants | Portugal | 2.0 /100 | #244 | Tragic 88.3% |
| Immigrants | Czechoslovakia | 1.9 /100 | #245 | Tragic 88.3% |
| Menominee | 1.9 /100 | #246 | Tragic 88.3% |
Demographics Similar to Slovenes by 1 or more Vehicles in Household
In terms of 1 or more vehicles in household, the demographic groups most similar to Slovenes are Hawaiian (92.0%, a difference of 0.010%), Korean (92.1%, a difference of 0.040%), Celtic (92.1%, a difference of 0.060%), Immigrants from Afghanistan (92.0%, a difference of 0.060%), and Immigrants from Venezuela (92.0%, a difference of 0.060%).
| Demographics | Rating | Rank | 1 or more Vehicles in Household |
| Northern Europeans | 99.9 /100 | #47 | Exceptional 92.2% |
| Belgians | 99.9 /100 | #48 | Exceptional 92.1% |
| Afghans | 99.9 /100 | #49 | Exceptional 92.1% |
| Guamanians/Chamorros | 99.9 /100 | #50 | Exceptional 92.1% |
| Celtics | 99.9 /100 | #51 | Exceptional 92.1% |
| Koreans | 99.9 /100 | #52 | Exceptional 92.1% |
| Hawaiians | 99.9 /100 | #53 | Exceptional 92.0% |
| Slovenes | 99.9 /100 | #54 | Exceptional 92.0% |
| Immigrants | Afghanistan | 99.9 /100 | #55 | Exceptional 92.0% |
| Immigrants | Venezuela | 99.9 /100 | #56 | Exceptional 92.0% |
| Iraqis | 99.8 /100 | #57 | Exceptional 91.9% |
| Immigrants | Mexico | 99.8 /100 | #58 | Exceptional 91.9% |
| Venezuelans | 99.8 /100 | #59 | Exceptional 91.9% |
| Slovaks | 99.8 /100 | #60 | Exceptional 91.9% |
| Immigrants | India | 99.8 /100 | #61 | Exceptional 91.9% |