Zimbabwean vs Nigerian 1 or more Vehicles in Household
COMPARE
Zimbabwean
Nigerian
1 or more Vehicles in Household
1 or more Vehicles in Household Comparison
Zimbabweans
Nigerians
91.0%
1 OR MORE VEHICLES IN HOUSEHOLD
97.7/ 100
METRIC RATING
106th/ 347
METRIC RANK
88.0%
1 OR MORE VEHICLES IN HOUSEHOLD
0.8/ 100
METRIC RATING
259th/ 347
METRIC RANK
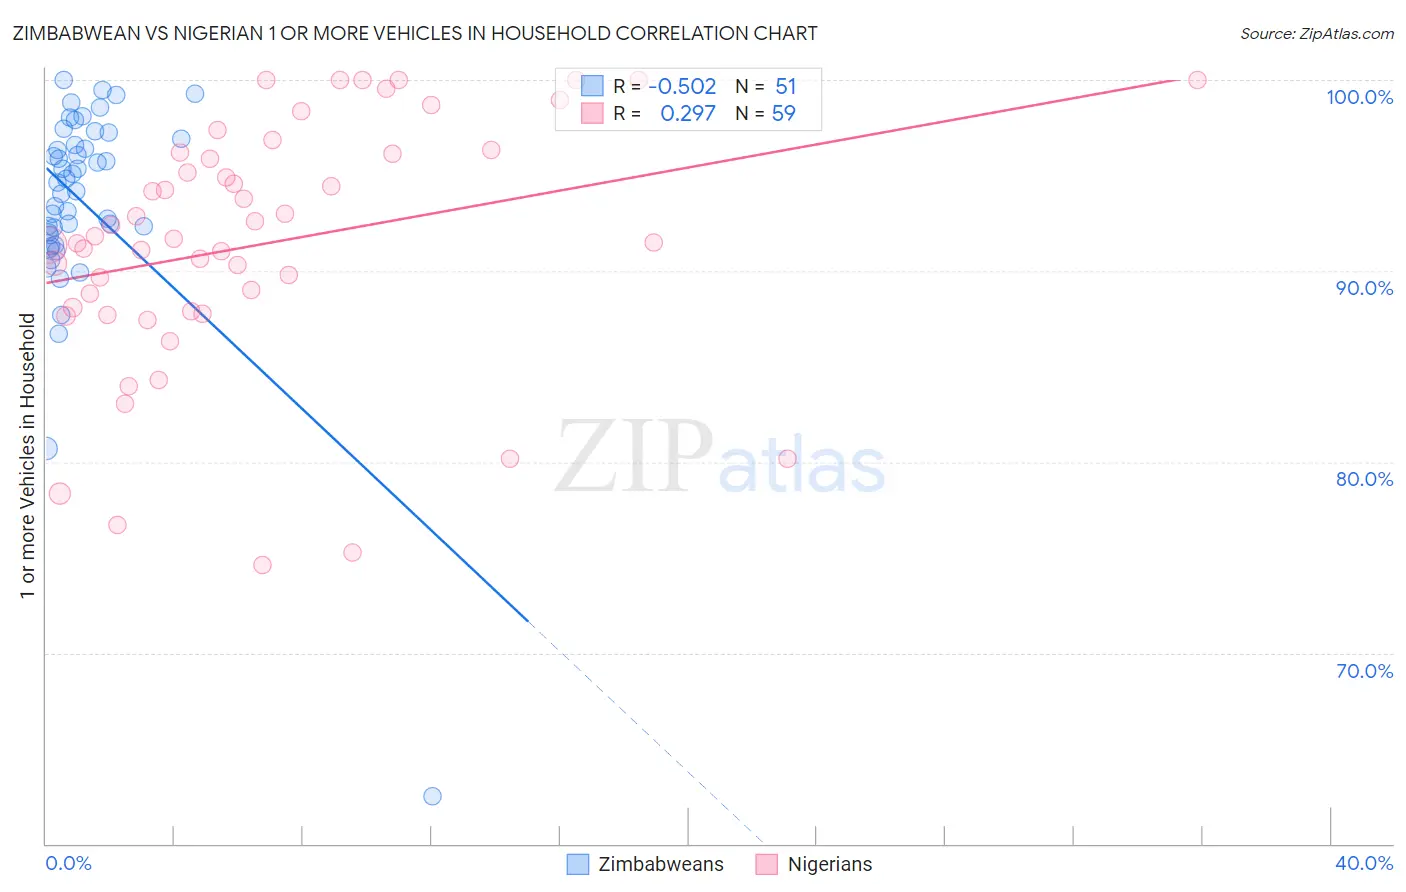
Zimbabwean vs Nigerian 1 or more Vehicles in Household Correlation Chart
The statistical analysis conducted on geographies consisting of 69,192,017 people shows a substantial negative correlation between the proportion of Zimbabweans and percentage of households with 1 or more vehicles available in the United States with a correlation coefficient (R) of -0.502 and weighted average of 91.0%. Similarly, the statistical analysis conducted on geographies consisting of 332,510,990 people shows a weak positive correlation between the proportion of Nigerians and percentage of households with 1 or more vehicles available in the United States with a correlation coefficient (R) of 0.297 and weighted average of 88.0%, a difference of 3.4%.
1 or more Vehicles in Household Correlation Summary
| Measurement | Zimbabwean | Nigerian |
| Minimum | 62.5% | 74.6% |
| Maximum | 100.0% | 100.0% |
| Range | 37.5% | 25.4% |
| Mean | 93.6% | 91.4% |
| Median | 94.6% | 91.7% |
| Interquartile 25% (IQ1) | 91.9% | 87.9% |
| Interquartile 75% (IQ3) | 96.9% | 96.2% |
| Interquartile Range (IQR) | 5.0% | 8.3% |
| Standard Deviation (Sample) | 5.8% | 6.5% |
| Standard Deviation (Population) | 5.7% | 6.5% |
Similar Demographics by 1 or more Vehicles in Household
Demographics Similar to Zimbabweans by 1 or more Vehicles in Household
In terms of 1 or more vehicles in household, the demographic groups most similar to Zimbabweans are Maltese (91.0%, a difference of 0.020%), Hispanic or Latino (91.0%, a difference of 0.020%), Delaware (91.0%, a difference of 0.020%), Laotian (91.0%, a difference of 0.040%), and Mexican American Indian (91.0%, a difference of 0.050%).
| Demographics | Rating | Rank | 1 or more Vehicles in Household |
| Immigrants | Bolivia | 98.6 /100 | #99 | Exceptional 91.2% |
| Immigrants | Central America | 98.4 /100 | #100 | Exceptional 91.1% |
| Bulgarians | 98.4 /100 | #101 | Exceptional 91.1% |
| Seminole | 98.3 /100 | #102 | Exceptional 91.1% |
| Yugoslavians | 98.3 /100 | #103 | Exceptional 91.1% |
| Asians | 98.2 /100 | #104 | Exceptional 91.1% |
| Laotians | 98.0 /100 | #105 | Exceptional 91.0% |
| Zimbabweans | 97.7 /100 | #106 | Exceptional 91.0% |
| Maltese | 97.7 /100 | #107 | Exceptional 91.0% |
| Hispanics or Latinos | 97.6 /100 | #108 | Exceptional 91.0% |
| Delaware | 97.6 /100 | #109 | Exceptional 91.0% |
| Mexican American Indians | 97.4 /100 | #110 | Exceptional 91.0% |
| Navajo | 95.8 /100 | #111 | Exceptional 90.8% |
| Immigrants | Netherlands | 95.7 /100 | #112 | Exceptional 90.8% |
| Immigrants | Kuwait | 94.7 /100 | #113 | Exceptional 90.7% |
Demographics Similar to Nigerians by 1 or more Vehicles in Household
In terms of 1 or more vehicles in household, the demographic groups most similar to Nigerians are Liberian (88.0%, a difference of 0.030%), South American Indian (88.0%, a difference of 0.030%), Immigrants from Latvia (88.1%, a difference of 0.040%), Colombian (88.0%, a difference of 0.040%), and Honduran (88.1%, a difference of 0.070%).
| Demographics | Rating | Rank | 1 or more Vehicles in Household |
| Immigrants | Uruguay | 1.1 /100 | #252 | Tragic 88.1% |
| Hondurans | 1.0 /100 | #253 | Tragic 88.1% |
| Haitians | 0.9 /100 | #254 | Tragic 88.1% |
| Immigrants | Latvia | 0.9 /100 | #255 | Tragic 88.1% |
| Colombians | 0.9 /100 | #256 | Tragic 88.0% |
| Liberians | 0.9 /100 | #257 | Tragic 88.0% |
| South American Indians | 0.9 /100 | #258 | Tragic 88.0% |
| Nigerians | 0.8 /100 | #259 | Tragic 88.0% |
| Macedonians | 0.6 /100 | #260 | Tragic 87.9% |
| Immigrants | Switzerland | 0.6 /100 | #261 | Tragic 87.9% |
| Sub-Saharan Africans | 0.5 /100 | #262 | Tragic 87.9% |
| Immigrants | Egypt | 0.5 /100 | #263 | Tragic 87.8% |
| Immigrants | Liberia | 0.4 /100 | #264 | Tragic 87.8% |
| Africans | 0.4 /100 | #265 | Tragic 87.8% |
| Israelis | 0.3 /100 | #266 | Tragic 87.7% |