Cree vs Nigerian 1 or more Vehicles in Household
COMPARE
Cree
Nigerian
1 or more Vehicles in Household
1 or more Vehicles in Household Comparison
Cree
Nigerians
88.7%
1 OR MORE VEHICLES IN HOUSEHOLD
6.0/ 100
METRIC RATING
225th/ 347
METRIC RANK
88.0%
1 OR MORE VEHICLES IN HOUSEHOLD
0.8/ 100
METRIC RATING
259th/ 347
METRIC RANK
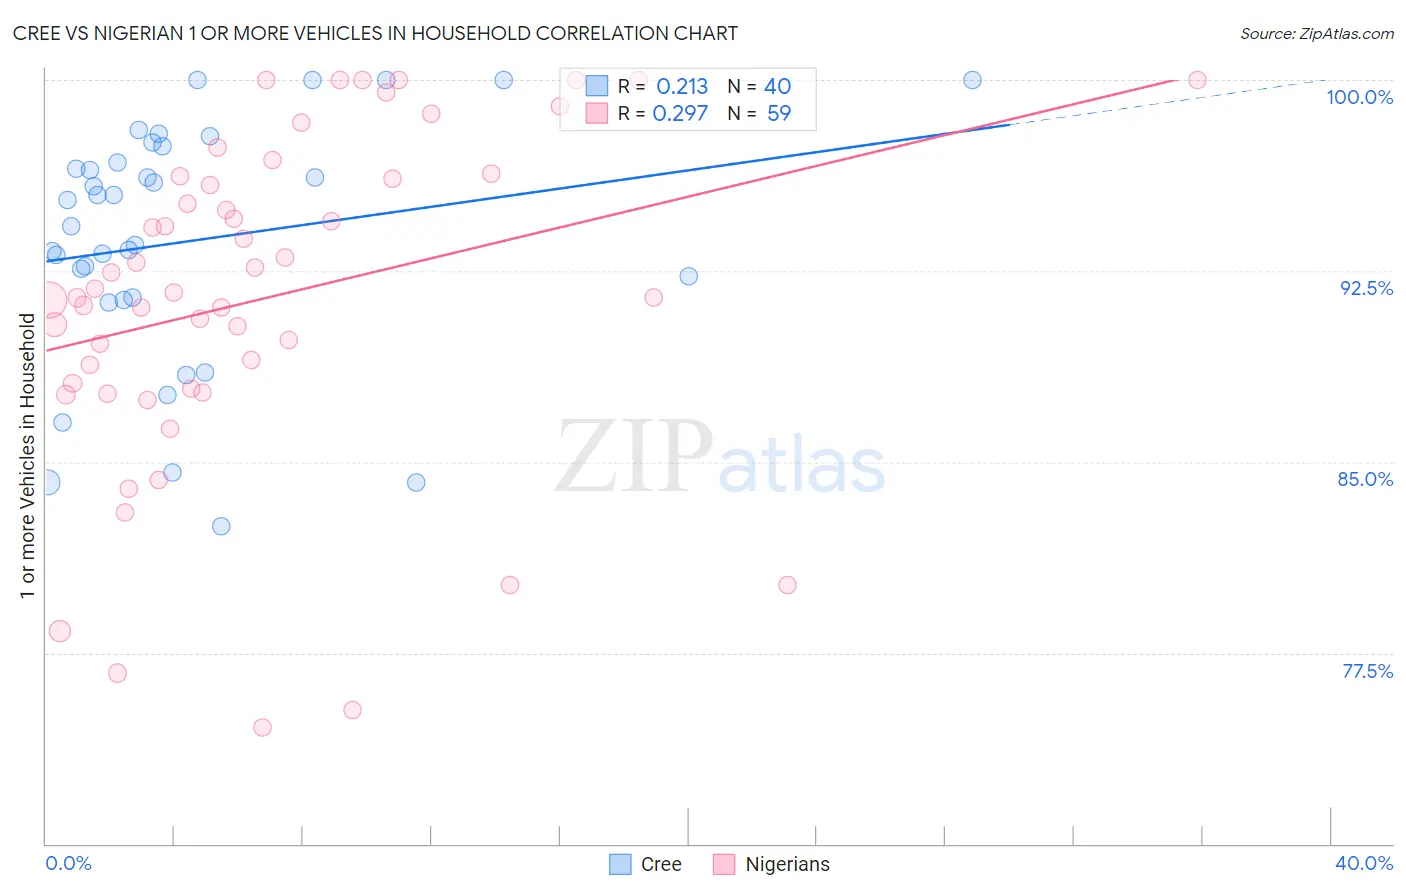
Cree vs Nigerian 1 or more Vehicles in Household Correlation Chart
The statistical analysis conducted on geographies consisting of 76,210,304 people shows a weak positive correlation between the proportion of Cree and percentage of households with 1 or more vehicles available in the United States with a correlation coefficient (R) of 0.213 and weighted average of 88.7%. Similarly, the statistical analysis conducted on geographies consisting of 332,510,990 people shows a weak positive correlation between the proportion of Nigerians and percentage of households with 1 or more vehicles available in the United States with a correlation coefficient (R) of 0.297 and weighted average of 88.0%, a difference of 0.82%.
1 or more Vehicles in Household Correlation Summary
| Measurement | Cree | Nigerian |
| Minimum | 82.5% | 74.6% |
| Maximum | 100.0% | 100.0% |
| Range | 17.5% | 25.4% |
| Mean | 93.7% | 91.4% |
| Median | 94.8% | 91.7% |
| Interquartile 25% (IQ1) | 91.4% | 87.9% |
| Interquartile 75% (IQ3) | 97.1% | 96.2% |
| Interquartile Range (IQR) | 5.7% | 8.3% |
| Standard Deviation (Sample) | 4.8% | 6.5% |
| Standard Deviation (Population) | 4.7% | 6.5% |
Similar Demographics by 1 or more Vehicles in Household
Demographics Similar to Cree by 1 or more Vehicles in Household
In terms of 1 or more vehicles in household, the demographic groups most similar to Cree are Immigrants from Hong Kong (88.7%, a difference of 0.010%), Cheyenne (88.7%, a difference of 0.030%), Ute (88.7%, a difference of 0.030%), Immigrants from Norway (88.7%, a difference of 0.040%), and Immigrants from Romania (88.7%, a difference of 0.050%).
| Demographics | Rating | Rank | 1 or more Vehicles in Household |
| Ugandans | 8.7 /100 | #218 | Tragic 88.9% |
| Immigrants | Guatemala | 8.6 /100 | #219 | Tragic 88.9% |
| Immigrants | Zaire | 8.1 /100 | #220 | Tragic 88.8% |
| Peruvians | 7.9 /100 | #221 | Tragic 88.8% |
| Uruguayans | 7.0 /100 | #222 | Tragic 88.8% |
| Immigrants | South America | 7.0 /100 | #223 | Tragic 88.8% |
| Immigrants | Hong Kong | 6.2 /100 | #224 | Tragic 88.7% |
| Cree | 6.0 /100 | #225 | Tragic 88.7% |
| Cheyenne | 5.7 /100 | #226 | Tragic 88.7% |
| Ute | 5.6 /100 | #227 | Tragic 88.7% |
| Immigrants | Norway | 5.5 /100 | #228 | Tragic 88.7% |
| Immigrants | Romania | 5.4 /100 | #229 | Tragic 88.7% |
| Immigrants | Sierra Leone | 5.2 /100 | #230 | Tragic 88.7% |
| Russians | 5.0 /100 | #231 | Tragic 88.7% |
| Immigrants | Japan | 4.9 /100 | #232 | Tragic 88.7% |
Demographics Similar to Nigerians by 1 or more Vehicles in Household
In terms of 1 or more vehicles in household, the demographic groups most similar to Nigerians are Liberian (88.0%, a difference of 0.030%), South American Indian (88.0%, a difference of 0.030%), Immigrants from Latvia (88.1%, a difference of 0.040%), Colombian (88.0%, a difference of 0.040%), and Honduran (88.1%, a difference of 0.070%).
| Demographics | Rating | Rank | 1 or more Vehicles in Household |
| Immigrants | Uruguay | 1.1 /100 | #252 | Tragic 88.1% |
| Hondurans | 1.0 /100 | #253 | Tragic 88.1% |
| Haitians | 0.9 /100 | #254 | Tragic 88.1% |
| Immigrants | Latvia | 0.9 /100 | #255 | Tragic 88.1% |
| Colombians | 0.9 /100 | #256 | Tragic 88.0% |
| Liberians | 0.9 /100 | #257 | Tragic 88.0% |
| South American Indians | 0.9 /100 | #258 | Tragic 88.0% |
| Nigerians | 0.8 /100 | #259 | Tragic 88.0% |
| Macedonians | 0.6 /100 | #260 | Tragic 87.9% |
| Immigrants | Switzerland | 0.6 /100 | #261 | Tragic 87.9% |
| Sub-Saharan Africans | 0.5 /100 | #262 | Tragic 87.9% |
| Immigrants | Egypt | 0.5 /100 | #263 | Tragic 87.8% |
| Immigrants | Liberia | 0.4 /100 | #264 | Tragic 87.8% |
| Africans | 0.4 /100 | #265 | Tragic 87.8% |
| Israelis | 0.3 /100 | #266 | Tragic 87.7% |