Kiowa vs Ecuadorian High School Diploma
COMPARE
Kiowa
Ecuadorian
High School Diploma
High School Diploma Comparison
Kiowa
Ecuadorians
88.2%
HIGH SCHOOL DIPLOMA
5.3/ 100
METRIC RATING
228th/ 347
METRIC RANK
85.1%
HIGH SCHOOL DIPLOMA
0.0/ 100
METRIC RATING
311th/ 347
METRIC RANK
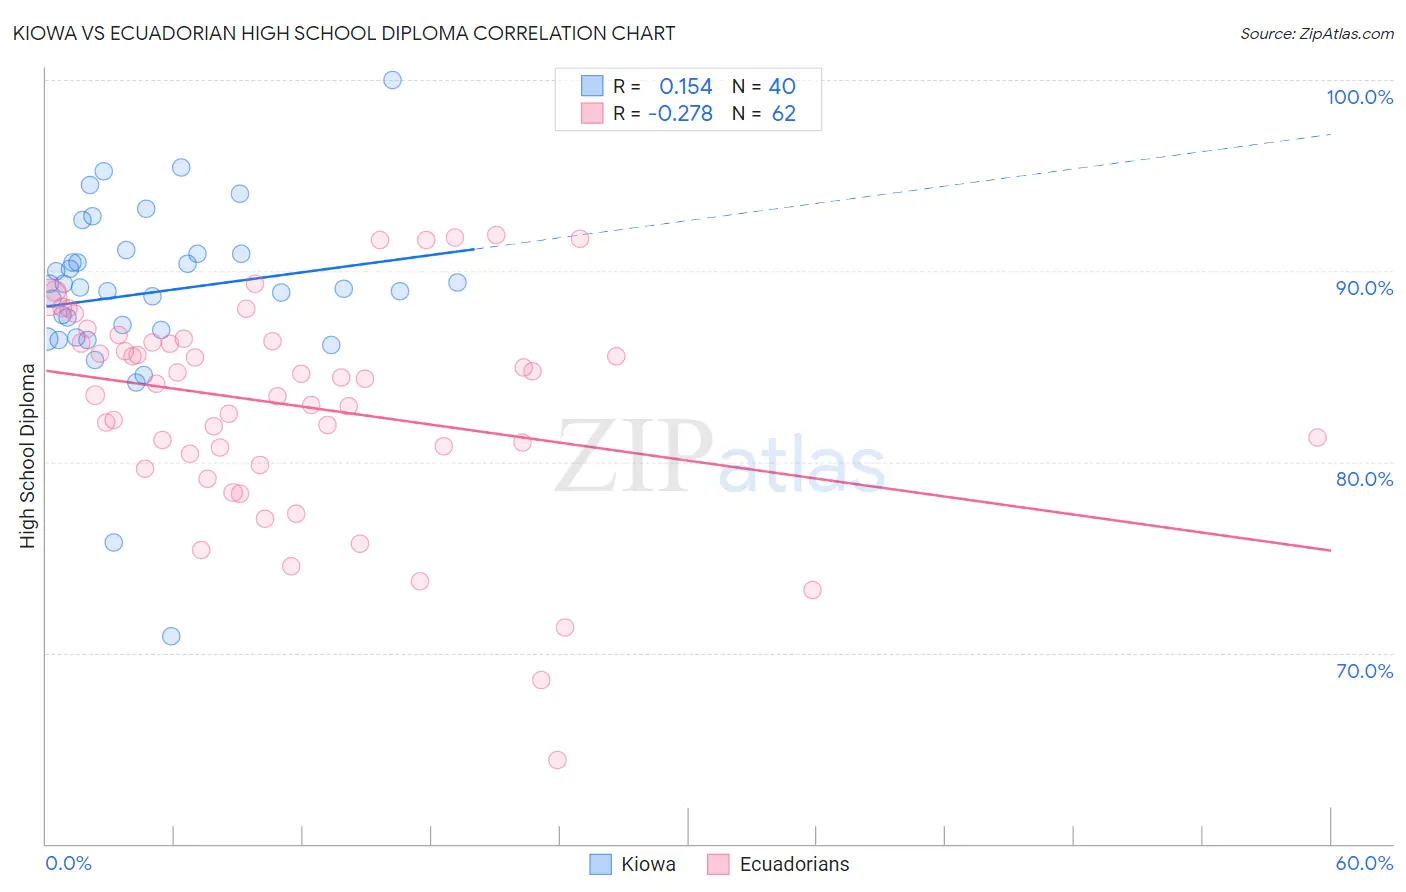
Kiowa vs Ecuadorian High School Diploma Correlation Chart
The statistical analysis conducted on geographies consisting of 56,101,759 people shows a poor positive correlation between the proportion of Kiowa and percentage of population with at least high school diploma education in the United States with a correlation coefficient (R) of 0.154 and weighted average of 88.2%. Similarly, the statistical analysis conducted on geographies consisting of 317,865,755 people shows a weak negative correlation between the proportion of Ecuadorians and percentage of population with at least high school diploma education in the United States with a correlation coefficient (R) of -0.278 and weighted average of 85.1%, a difference of 3.6%.
High School Diploma Correlation Summary
| Measurement | Kiowa | Ecuadorian |
| Minimum | 70.9% | 64.4% |
| Maximum | 100.0% | 91.9% |
| Range | 29.1% | 27.5% |
| Mean | 88.9% | 83.0% |
| Median | 89.1% | 84.2% |
| Interquartile 25% (IQ1) | 86.7% | 80.4% |
| Interquartile 75% (IQ3) | 90.9% | 86.3% |
| Interquartile Range (IQR) | 4.2% | 5.9% |
| Standard Deviation (Sample) | 4.9% | 5.7% |
| Standard Deviation (Population) | 4.8% | 5.6% |
Similar Demographics by High School Diploma
Demographics Similar to Kiowa by High School Diploma
In terms of high school diploma, the demographic groups most similar to Kiowa are Immigrants from Liberia (88.2%, a difference of 0.010%), Nigerian (88.2%, a difference of 0.010%), Uruguayan (88.2%, a difference of 0.020%), Blackfeet (88.1%, a difference of 0.090%), and Shoshone (88.3%, a difference of 0.11%).
| Demographics | Rating | Rank | High School Diploma |
| Immigrants | Afghanistan | 8.6 /100 | #221 | Tragic 88.3% |
| Colville | 7.8 /100 | #222 | Tragic 88.3% |
| Immigrants | Zaire | 7.6 /100 | #223 | Tragic 88.3% |
| Shoshone | 7.0 /100 | #224 | Tragic 88.3% |
| Creek | 6.9 /100 | #225 | Tragic 88.3% |
| Uruguayans | 5.6 /100 | #226 | Tragic 88.2% |
| Immigrants | Liberia | 5.5 /100 | #227 | Tragic 88.2% |
| Kiowa | 5.3 /100 | #228 | Tragic 88.2% |
| Nigerians | 5.2 /100 | #229 | Tragic 88.2% |
| Blackfeet | 4.2 /100 | #230 | Tragic 88.1% |
| Colombians | 3.8 /100 | #231 | Tragic 88.1% |
| Immigrants | Middle Africa | 3.4 /100 | #232 | Tragic 88.0% |
| Immigrants | Panama | 3.1 /100 | #233 | Tragic 88.0% |
| Immigrants | Thailand | 3.1 /100 | #234 | Tragic 88.0% |
| Immigrants | Bahamas | 2.9 /100 | #235 | Tragic 88.0% |
Demographics Similar to Ecuadorians by High School Diploma
In terms of high school diploma, the demographic groups most similar to Ecuadorians are Apache (85.1%, a difference of 0.010%), Cape Verdean (85.1%, a difference of 0.050%), Immigrants from Dominica (85.2%, a difference of 0.090%), Immigrants from Armenia (85.2%, a difference of 0.10%), and Navajo (85.2%, a difference of 0.11%).
| Demographics | Rating | Rank | High School Diploma |
| Nepalese | 0.0 /100 | #304 | Tragic 85.3% |
| Immigrants | Portugal | 0.0 /100 | #305 | Tragic 85.3% |
| Immigrants | Guyana | 0.0 /100 | #306 | Tragic 85.3% |
| Navajo | 0.0 /100 | #307 | Tragic 85.2% |
| Immigrants | Armenia | 0.0 /100 | #308 | Tragic 85.2% |
| Immigrants | Dominica | 0.0 /100 | #309 | Tragic 85.2% |
| Apache | 0.0 /100 | #310 | Tragic 85.1% |
| Ecuadorians | 0.0 /100 | #311 | Tragic 85.1% |
| Cape Verdeans | 0.0 /100 | #312 | Tragic 85.1% |
| Immigrants | Ecuador | 0.0 /100 | #313 | Tragic 84.8% |
| Yaqui | 0.0 /100 | #314 | Tragic 84.7% |
| Puerto Ricans | 0.0 /100 | #315 | Tragic 84.7% |
| Belizeans | 0.0 /100 | #316 | Tragic 84.3% |
| Immigrants | Caribbean | 0.0 /100 | #317 | Tragic 84.3% |
| Immigrants | Belize | 0.0 /100 | #318 | Tragic 84.2% |