Palestinian vs Trinidadian and Tobagonian 1 or more Vehicles in Household
COMPARE
Palestinian
Trinidadian and Tobagonian
1 or more Vehicles in Household
1 or more Vehicles in Household Comparison
Palestinians
Trinidadians and Tobagonians
91.7%
1 OR MORE VEHICLES IN HOUSEHOLD
99.7/ 100
METRIC RATING
69th/ 347
METRIC RANK
76.3%
1 OR MORE VEHICLES IN HOUSEHOLD
0.0/ 100
METRIC RATING
332nd/ 347
METRIC RANK
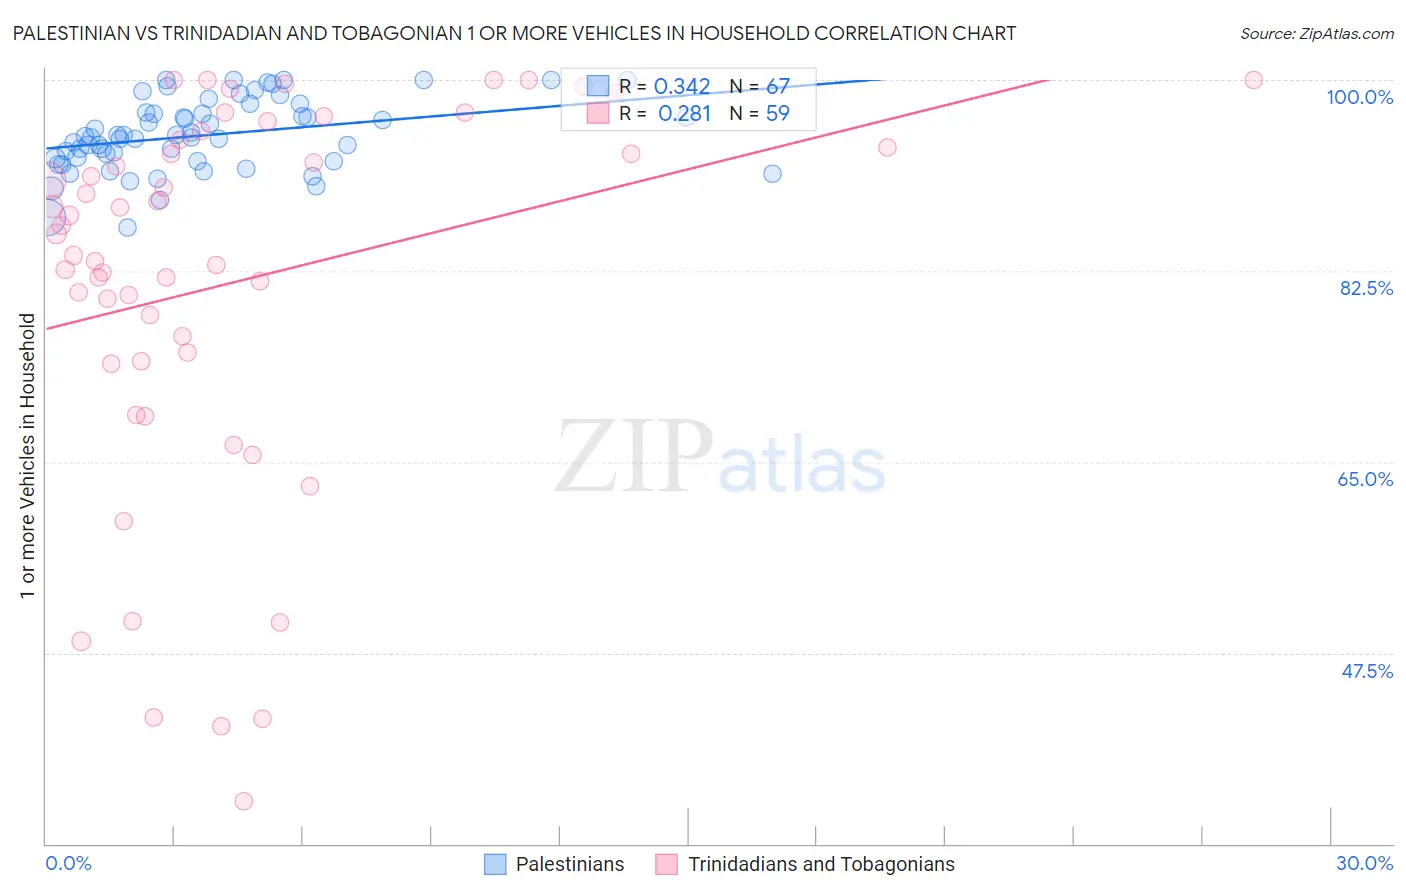
Palestinian vs Trinidadian and Tobagonian 1 or more Vehicles in Household Correlation Chart
The statistical analysis conducted on geographies consisting of 216,371,451 people shows a mild positive correlation between the proportion of Palestinians and percentage of households with 1 or more vehicles available in the United States with a correlation coefficient (R) of 0.342 and weighted average of 91.7%. Similarly, the statistical analysis conducted on geographies consisting of 219,744,426 people shows a weak positive correlation between the proportion of Trinidadians and Tobagonians and percentage of households with 1 or more vehicles available in the United States with a correlation coefficient (R) of 0.281 and weighted average of 76.3%, a difference of 20.2%.
1 or more Vehicles in Household Correlation Summary
| Measurement | Palestinian | Trinidadian and Tobagonian |
| Minimum | 86.4% | 33.9% |
| Maximum | 100.0% | 100.0% |
| Range | 13.6% | 66.1% |
| Mean | 94.9% | 81.5% |
| Median | 94.8% | 85.9% |
| Interquartile 25% (IQ1) | 92.6% | 74.2% |
| Interquartile 75% (IQ3) | 97.0% | 94.5% |
| Interquartile Range (IQR) | 4.4% | 20.3% |
| Standard Deviation (Sample) | 3.3% | 17.3% |
| Standard Deviation (Population) | 3.2% | 17.2% |
Similar Demographics by 1 or more Vehicles in Household
Demographics Similar to Palestinians by 1 or more Vehicles in Household
In terms of 1 or more vehicles in household, the demographic groups most similar to Palestinians are Lithuanian (91.7%, a difference of 0.020%), Immigrants from Scotland (91.8%, a difference of 0.040%), Polish (91.7%, a difference of 0.040%), Cajun (91.7%, a difference of 0.040%), and Immigrants from Iran (91.7%, a difference of 0.050%).
| Demographics | Rating | Rank | 1 or more Vehicles in Household |
| Thais | 99.8 /100 | #62 | Exceptional 91.9% |
| Chinese | 99.8 /100 | #63 | Exceptional 91.9% |
| Croatians | 99.8 /100 | #64 | Exceptional 91.9% |
| Immigrants | Laos | 99.8 /100 | #65 | Exceptional 91.8% |
| Canadians | 99.8 /100 | #66 | Exceptional 91.8% |
| Spaniards | 99.8 /100 | #67 | Exceptional 91.8% |
| Immigrants | Scotland | 99.7 /100 | #68 | Exceptional 91.8% |
| Palestinians | 99.7 /100 | #69 | Exceptional 91.7% |
| Lithuanians | 99.7 /100 | #70 | Exceptional 91.7% |
| Poles | 99.7 /100 | #71 | Exceptional 91.7% |
| Cajuns | 99.7 /100 | #72 | Exceptional 91.7% |
| Immigrants | Iran | 99.7 /100 | #73 | Exceptional 91.7% |
| Immigrants | Lebanon | 99.6 /100 | #74 | Exceptional 91.6% |
| Portuguese | 99.5 /100 | #75 | Exceptional 91.6% |
| Cubans | 99.5 /100 | #76 | Exceptional 91.5% |
Demographics Similar to Trinidadians and Tobagonians by 1 or more Vehicles in Household
In terms of 1 or more vehicles in household, the demographic groups most similar to Trinidadians and Tobagonians are West Indian (76.4%, a difference of 0.080%), Immigrants from Ecuador (76.2%, a difference of 0.10%), Immigrants from Trinidad and Tobago (76.8%, a difference of 0.64%), Immigrants from Dominica (77.8%, a difference of 2.0%), and Ecuadorian (77.9%, a difference of 2.1%).
| Demographics | Rating | Rank | 1 or more Vehicles in Household |
| Senegalese | 0.0 /100 | #325 | Tragic 80.4% |
| Immigrants | West Indies | 0.0 /100 | #326 | Tragic 79.5% |
| Immigrants | Senegal | 0.0 /100 | #327 | Tragic 79.0% |
| Ecuadorians | 0.0 /100 | #328 | Tragic 77.9% |
| Immigrants | Dominica | 0.0 /100 | #329 | Tragic 77.8% |
| Immigrants | Trinidad and Tobago | 0.0 /100 | #330 | Tragic 76.8% |
| West Indians | 0.0 /100 | #331 | Tragic 76.4% |
| Trinidadians and Tobagonians | 0.0 /100 | #332 | Tragic 76.3% |
| Immigrants | Ecuador | 0.0 /100 | #333 | Tragic 76.2% |
| Immigrants | Bangladesh | 0.0 /100 | #334 | Tragic 74.3% |
| Barbadians | 0.0 /100 | #335 | Tragic 74.0% |
| Vietnamese | 0.0 /100 | #336 | Tragic 73.8% |
| Immigrants | Uzbekistan | 0.0 /100 | #337 | Tragic 73.4% |
| Inupiat | 0.0 /100 | #338 | Tragic 71.5% |
| Guyanese | 0.0 /100 | #339 | Tragic 70.8% |