Cambodian vs Trinidadian and Tobagonian 1 or more Vehicles in Household
COMPARE
Cambodian
Trinidadian and Tobagonian
1 or more Vehicles in Household
1 or more Vehicles in Household Comparison
Cambodians
Trinidadians and Tobagonians
89.2%
1 OR MORE VEHICLES IN HOUSEHOLD
18.9/ 100
METRIC RATING
203rd/ 347
METRIC RANK
76.3%
1 OR MORE VEHICLES IN HOUSEHOLD
0.0/ 100
METRIC RATING
332nd/ 347
METRIC RANK
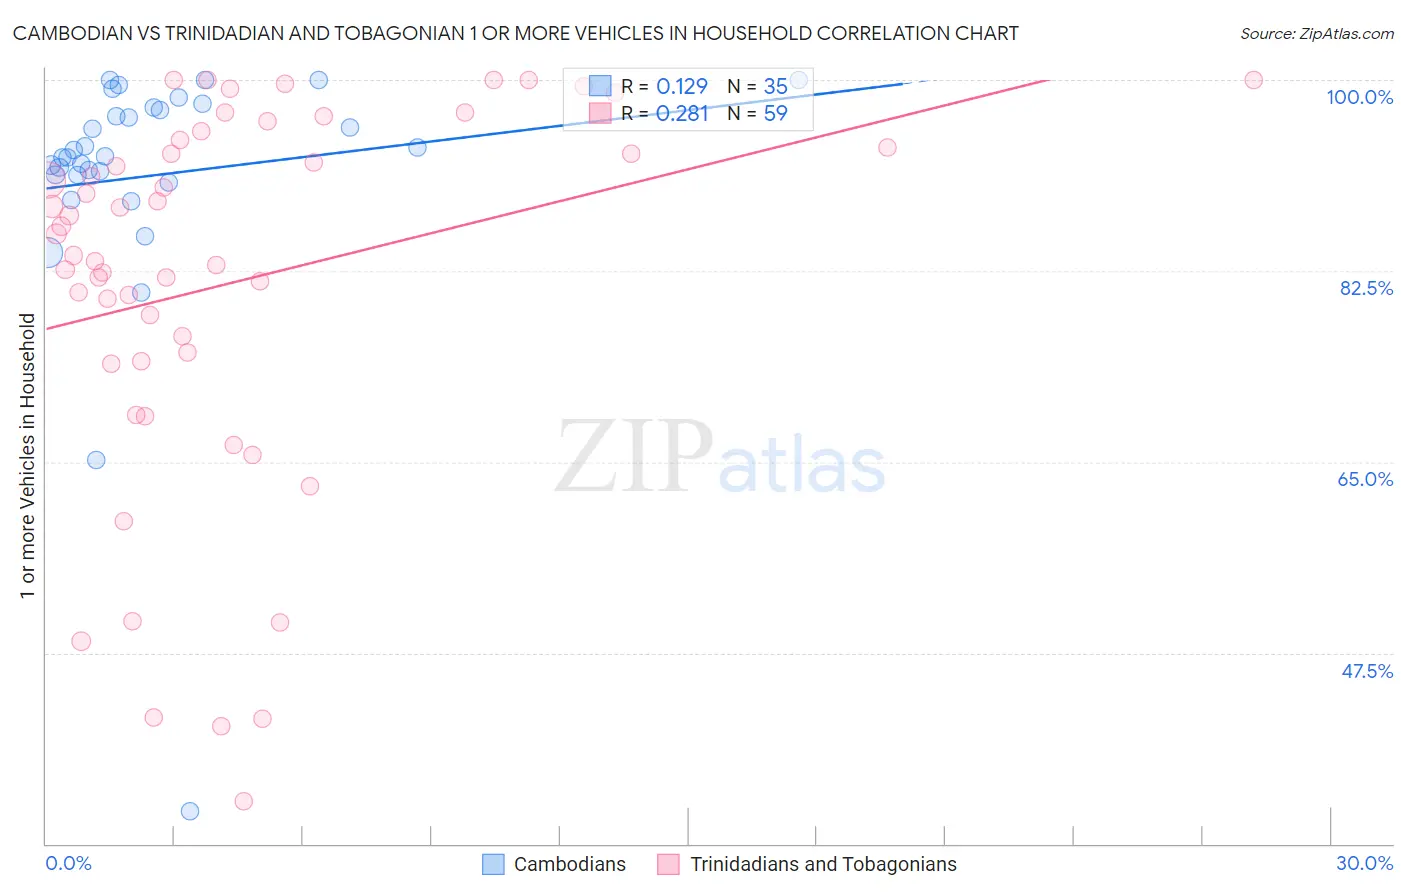
Cambodian vs Trinidadian and Tobagonian 1 or more Vehicles in Household Correlation Chart
The statistical analysis conducted on geographies consisting of 102,492,844 people shows a poor positive correlation between the proportion of Cambodians and percentage of households with 1 or more vehicles available in the United States with a correlation coefficient (R) of 0.129 and weighted average of 89.2%. Similarly, the statistical analysis conducted on geographies consisting of 219,744,426 people shows a weak positive correlation between the proportion of Trinidadians and Tobagonians and percentage of households with 1 or more vehicles available in the United States with a correlation coefficient (R) of 0.281 and weighted average of 76.3%, a difference of 16.9%.
1 or more Vehicles in Household Correlation Summary
| Measurement | Cambodian | Trinidadian and Tobagonian |
| Minimum | 33.0% | 33.9% |
| Maximum | 100.0% | 100.0% |
| Range | 67.0% | 66.1% |
| Mean | 91.3% | 81.5% |
| Median | 93.0% | 85.9% |
| Interquartile 25% (IQ1) | 91.3% | 74.2% |
| Interquartile 75% (IQ3) | 97.5% | 94.5% |
| Interquartile Range (IQR) | 6.2% | 20.3% |
| Standard Deviation (Sample) | 12.2% | 17.3% |
| Standard Deviation (Population) | 12.0% | 17.2% |
Similar Demographics by 1 or more Vehicles in Household
Demographics Similar to Cambodians by 1 or more Vehicles in Household
In terms of 1 or more vehicles in household, the demographic groups most similar to Cambodians are Iroquois (89.2%, a difference of 0.020%), Romanian (89.2%, a difference of 0.020%), Guatemalan (89.2%, a difference of 0.030%), Immigrants from Western Europe (89.2%, a difference of 0.040%), and Central American (89.2%, a difference of 0.060%).
| Demographics | Rating | Rank | 1 or more Vehicles in Household |
| Crow | 24.3 /100 | #196 | Fair 89.3% |
| Immigrants | Sweden | 23.6 /100 | #197 | Fair 89.3% |
| Pennsylvania Germans | 22.9 /100 | #198 | Fair 89.3% |
| Immigrants | Asia | 22.8 /100 | #199 | Fair 89.3% |
| Central Americans | 21.4 /100 | #200 | Fair 89.2% |
| Immigrants | Western Europe | 20.5 /100 | #201 | Fair 89.2% |
| Iroquois | 19.8 /100 | #202 | Poor 89.2% |
| Cambodians | 18.9 /100 | #203 | Poor 89.2% |
| Romanians | 18.2 /100 | #204 | Poor 89.2% |
| Guatemalans | 17.8 /100 | #205 | Poor 89.2% |
| Apache | 16.2 /100 | #206 | Poor 89.1% |
| Immigrants | Denmark | 14.8 /100 | #207 | Poor 89.1% |
| Immigrants | Chile | 14.4 /100 | #208 | Poor 89.1% |
| Immigrants | Italy | 14.0 /100 | #209 | Poor 89.1% |
| Dutch West Indians | 13.5 /100 | #210 | Poor 89.0% |
Demographics Similar to Trinidadians and Tobagonians by 1 or more Vehicles in Household
In terms of 1 or more vehicles in household, the demographic groups most similar to Trinidadians and Tobagonians are West Indian (76.4%, a difference of 0.080%), Immigrants from Ecuador (76.2%, a difference of 0.10%), Immigrants from Trinidad and Tobago (76.8%, a difference of 0.64%), Immigrants from Dominica (77.8%, a difference of 2.0%), and Ecuadorian (77.9%, a difference of 2.1%).
| Demographics | Rating | Rank | 1 or more Vehicles in Household |
| Senegalese | 0.0 /100 | #325 | Tragic 80.4% |
| Immigrants | West Indies | 0.0 /100 | #326 | Tragic 79.5% |
| Immigrants | Senegal | 0.0 /100 | #327 | Tragic 79.0% |
| Ecuadorians | 0.0 /100 | #328 | Tragic 77.9% |
| Immigrants | Dominica | 0.0 /100 | #329 | Tragic 77.8% |
| Immigrants | Trinidad and Tobago | 0.0 /100 | #330 | Tragic 76.8% |
| West Indians | 0.0 /100 | #331 | Tragic 76.4% |
| Trinidadians and Tobagonians | 0.0 /100 | #332 | Tragic 76.3% |
| Immigrants | Ecuador | 0.0 /100 | #333 | Tragic 76.2% |
| Immigrants | Bangladesh | 0.0 /100 | #334 | Tragic 74.3% |
| Barbadians | 0.0 /100 | #335 | Tragic 74.0% |
| Vietnamese | 0.0 /100 | #336 | Tragic 73.8% |
| Immigrants | Uzbekistan | 0.0 /100 | #337 | Tragic 73.4% |
| Inupiat | 0.0 /100 | #338 | Tragic 71.5% |
| Guyanese | 0.0 /100 | #339 | Tragic 70.8% |