Kenyan vs Paiute 1 or more Vehicles in Household
COMPARE
Kenyan
Paiute
1 or more Vehicles in Household
1 or more Vehicles in Household Comparison
Kenyans
Paiute
90.4%
1 OR MORE VEHICLES IN HOUSEHOLD
87.0/ 100
METRIC RATING
134th/ 347
METRIC RANK
88.6%
1 OR MORE VEHICLES IN HOUSEHOLD
4.6/ 100
METRIC RATING
235th/ 347
METRIC RANK
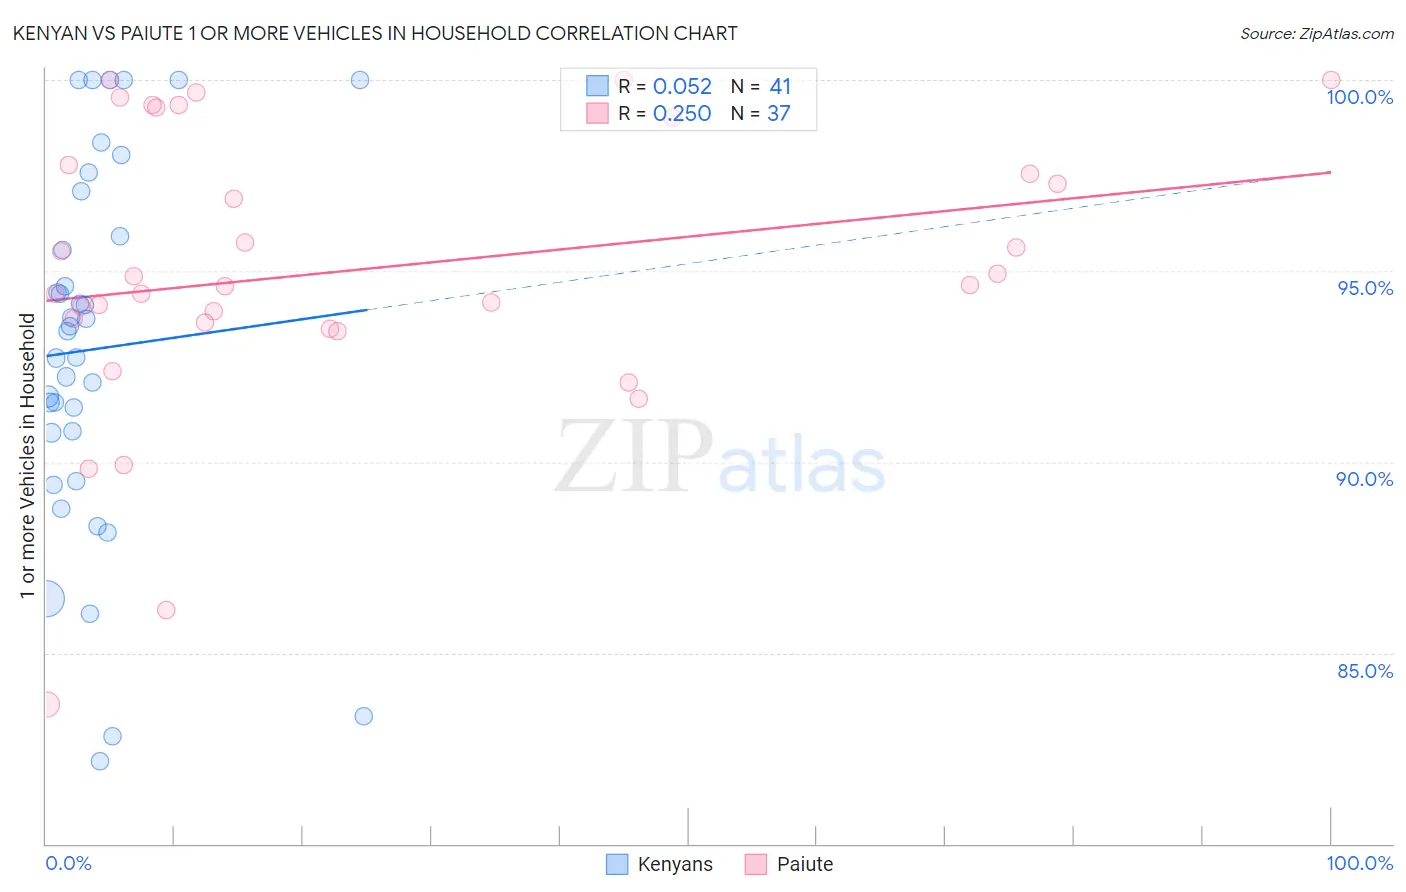
Kenyan vs Paiute 1 or more Vehicles in Household Correlation Chart
The statistical analysis conducted on geographies consisting of 168,180,305 people shows a slight positive correlation between the proportion of Kenyans and percentage of households with 1 or more vehicles available in the United States with a correlation coefficient (R) of 0.052 and weighted average of 90.4%. Similarly, the statistical analysis conducted on geographies consisting of 58,397,300 people shows a weak positive correlation between the proportion of Paiute and percentage of households with 1 or more vehicles available in the United States with a correlation coefficient (R) of 0.250 and weighted average of 88.6%, a difference of 1.9%.
1 or more Vehicles in Household Correlation Summary
| Measurement | Kenyan | Paiute |
| Minimum | 82.2% | 83.6% |
| Maximum | 100.0% | 100.0% |
| Range | 17.8% | 16.4% |
| Mean | 93.0% | 95.0% |
| Median | 93.4% | 94.6% |
| Interquartile 25% (IQ1) | 90.1% | 93.6% |
| Interquartile 75% (IQ3) | 96.5% | 98.4% |
| Interquartile Range (IQR) | 6.4% | 4.8% |
| Standard Deviation (Sample) | 4.8% | 3.8% |
| Standard Deviation (Population) | 4.8% | 3.7% |
Similar Demographics by 1 or more Vehicles in Household
Demographics Similar to Kenyans by 1 or more Vehicles in Household
In terms of 1 or more vehicles in household, the demographic groups most similar to Kenyans are Immigrants from Oceania (90.4%, a difference of 0.0%), Immigrants from Syria (90.4%, a difference of 0.020%), Hungarian (90.3%, a difference of 0.020%), Latvian (90.3%, a difference of 0.020%), and Syrian (90.3%, a difference of 0.020%).
| Demographics | Rating | Rank | 1 or more Vehicles in Household |
| Immigrants | Azores | 89.1 /100 | #127 | Excellent 90.4% |
| Burmese | 89.0 /100 | #128 | Excellent 90.4% |
| Marshallese | 88.9 /100 | #129 | Excellent 90.4% |
| Nicaraguans | 88.8 /100 | #130 | Excellent 90.4% |
| Immigrants | Kenya | 88.5 /100 | #131 | Excellent 90.4% |
| Immigrants | South Africa | 88.1 /100 | #132 | Excellent 90.4% |
| Immigrants | Syria | 87.5 /100 | #133 | Excellent 90.4% |
| Kenyans | 87.0 /100 | #134 | Excellent 90.4% |
| Immigrants | Oceania | 86.9 /100 | #135 | Excellent 90.4% |
| Hungarians | 86.5 /100 | #136 | Excellent 90.3% |
| Latvians | 86.3 /100 | #137 | Excellent 90.3% |
| Syrians | 86.3 /100 | #138 | Excellent 90.3% |
| Estonians | 85.6 /100 | #139 | Excellent 90.3% |
| Sudanese | 85.2 /100 | #140 | Excellent 90.3% |
| Immigrants | Moldova | 83.1 /100 | #141 | Excellent 90.2% |
Demographics Similar to Paiute by 1 or more Vehicles in Household
In terms of 1 or more vehicles in household, the demographic groups most similar to Paiute are Immigrants from Peru (88.6%, a difference of 0.0%), Houma (88.6%, a difference of 0.010%), Immigrants from Pakistan (88.6%, a difference of 0.010%), Immigrants from Turkey (88.6%, a difference of 0.020%), and Russian (88.7%, a difference of 0.030%).
| Demographics | Rating | Rank | 1 or more Vehicles in Household |
| Immigrants | Norway | 5.5 /100 | #228 | Tragic 88.7% |
| Immigrants | Romania | 5.4 /100 | #229 | Tragic 88.7% |
| Immigrants | Sierra Leone | 5.2 /100 | #230 | Tragic 88.7% |
| Russians | 5.0 /100 | #231 | Tragic 88.7% |
| Immigrants | Japan | 4.9 /100 | #232 | Tragic 88.7% |
| Houma | 4.8 /100 | #233 | Tragic 88.6% |
| Immigrants | Peru | 4.7 /100 | #234 | Tragic 88.6% |
| Paiute | 4.6 /100 | #235 | Tragic 88.6% |
| Immigrants | Pakistan | 4.5 /100 | #236 | Tragic 88.6% |
| Immigrants | Turkey | 4.4 /100 | #237 | Tragic 88.6% |
| Immigrants | Somalia | 4.2 /100 | #238 | Tragic 88.6% |
| Kiowa | 3.8 /100 | #239 | Tragic 88.6% |
| Eastern Europeans | 3.0 /100 | #240 | Tragic 88.5% |
| Taiwanese | 2.6 /100 | #241 | Tragic 88.4% |
| Turks | 2.5 /100 | #242 | Tragic 88.4% |