Samoan vs Trinidadian and Tobagonian 1 or more Vehicles in Household
COMPARE
Samoan
Trinidadian and Tobagonian
1 or more Vehicles in Household
1 or more Vehicles in Household Comparison
Samoans
Trinidadians and Tobagonians
92.4%
1 OR MORE VEHICLES IN HOUSEHOLD
100.0/ 100
METRIC RATING
31st/ 347
METRIC RANK
76.3%
1 OR MORE VEHICLES IN HOUSEHOLD
0.0/ 100
METRIC RATING
332nd/ 347
METRIC RANK
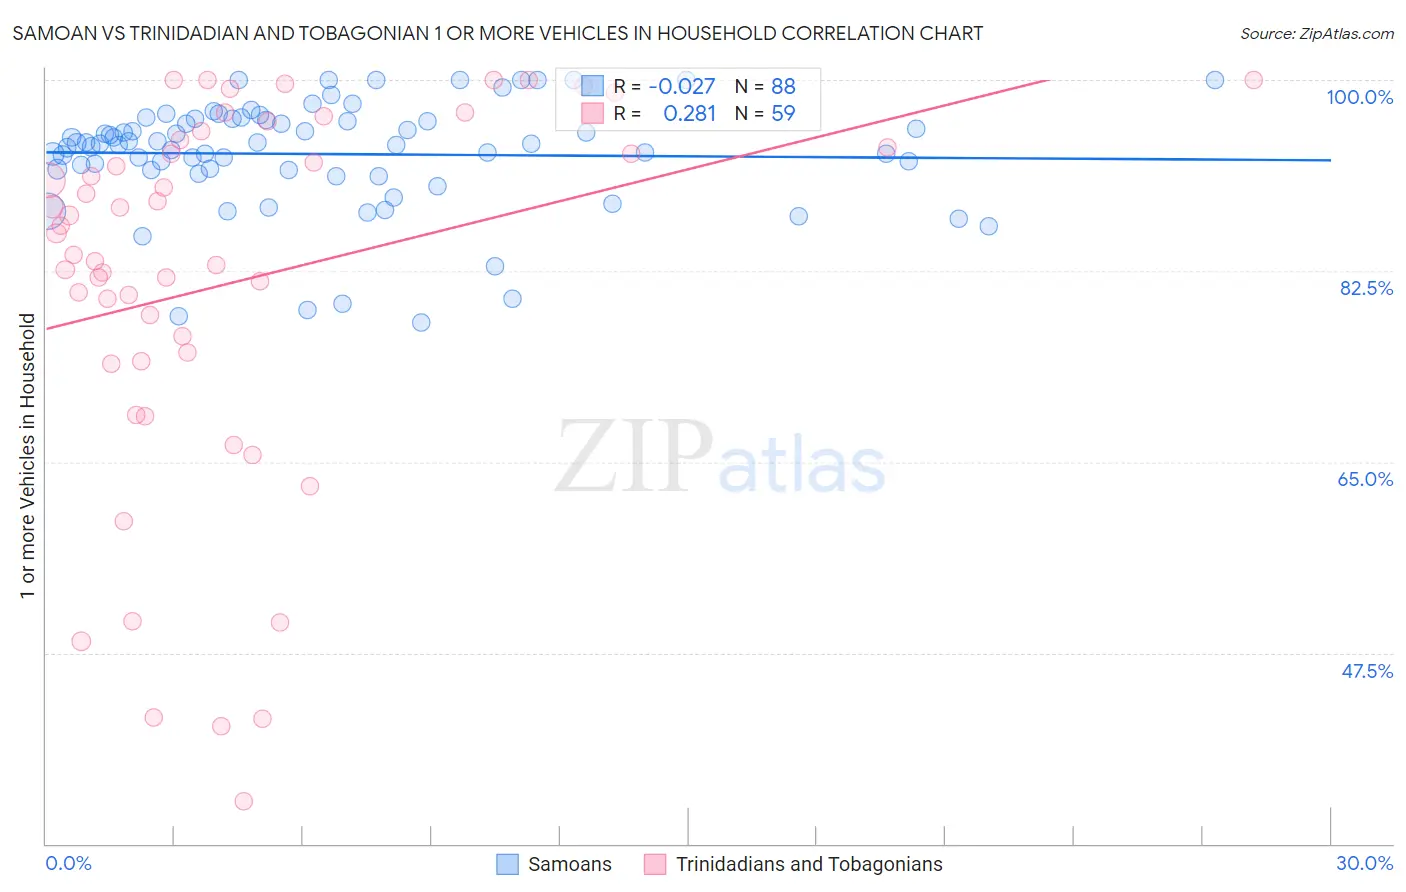
Samoan vs Trinidadian and Tobagonian 1 or more Vehicles in Household Correlation Chart
The statistical analysis conducted on geographies consisting of 225,090,102 people shows no correlation between the proportion of Samoans and percentage of households with 1 or more vehicles available in the United States with a correlation coefficient (R) of -0.027 and weighted average of 92.4%. Similarly, the statistical analysis conducted on geographies consisting of 219,744,426 people shows a weak positive correlation between the proportion of Trinidadians and Tobagonians and percentage of households with 1 or more vehicles available in the United States with a correlation coefficient (R) of 0.281 and weighted average of 76.3%, a difference of 21.1%.
1 or more Vehicles in Household Correlation Summary
| Measurement | Samoan | Trinidadian and Tobagonian |
| Minimum | 77.7% | 33.9% |
| Maximum | 100.0% | 100.0% |
| Range | 22.3% | 66.1% |
| Mean | 93.2% | 81.5% |
| Median | 94.1% | 85.9% |
| Interquartile 25% (IQ1) | 91.7% | 74.2% |
| Interquartile 75% (IQ3) | 96.3% | 94.5% |
| Interquartile Range (IQR) | 4.6% | 20.3% |
| Standard Deviation (Sample) | 5.1% | 17.3% |
| Standard Deviation (Population) | 5.0% | 17.2% |
Similar Demographics by 1 or more Vehicles in Household
Demographics Similar to Samoans by 1 or more Vehicles in Household
In terms of 1 or more vehicles in household, the demographic groups most similar to Samoans are Native Hawaiian (92.4%, a difference of 0.010%), Finnish (92.4%, a difference of 0.010%), Sri Lankan (92.5%, a difference of 0.030%), Basque (92.4%, a difference of 0.040%), and Cherokee (92.4%, a difference of 0.050%).
| Demographics | Rating | Rank | 1 or more Vehicles in Household |
| Yaqui | 100.0 /100 | #24 | Exceptional 92.6% |
| Immigrants | Iraq | 100.0 /100 | #25 | Exceptional 92.5% |
| British | 100.0 /100 | #26 | Exceptional 92.5% |
| Americans | 100.0 /100 | #27 | Exceptional 92.5% |
| Sri Lankans | 100.0 /100 | #28 | Exceptional 92.5% |
| Native Hawaiians | 100.0 /100 | #29 | Exceptional 92.4% |
| Finns | 100.0 /100 | #30 | Exceptional 92.4% |
| Samoans | 100.0 /100 | #31 | Exceptional 92.4% |
| Basques | 100.0 /100 | #32 | Exceptional 92.4% |
| Cherokee | 100.0 /100 | #33 | Exceptional 92.4% |
| Italians | 99.9 /100 | #34 | Exceptional 92.3% |
| Czechoslovakians | 99.9 /100 | #35 | Exceptional 92.3% |
| Malaysians | 99.9 /100 | #36 | Exceptional 92.3% |
| French Canadians | 99.9 /100 | #37 | Exceptional 92.3% |
| Immigrants | Vietnam | 99.9 /100 | #38 | Exceptional 92.3% |
Demographics Similar to Trinidadians and Tobagonians by 1 or more Vehicles in Household
In terms of 1 or more vehicles in household, the demographic groups most similar to Trinidadians and Tobagonians are West Indian (76.4%, a difference of 0.080%), Immigrants from Ecuador (76.2%, a difference of 0.10%), Immigrants from Trinidad and Tobago (76.8%, a difference of 0.64%), Immigrants from Dominica (77.8%, a difference of 2.0%), and Ecuadorian (77.9%, a difference of 2.1%).
| Demographics | Rating | Rank | 1 or more Vehicles in Household |
| Senegalese | 0.0 /100 | #325 | Tragic 80.4% |
| Immigrants | West Indies | 0.0 /100 | #326 | Tragic 79.5% |
| Immigrants | Senegal | 0.0 /100 | #327 | Tragic 79.0% |
| Ecuadorians | 0.0 /100 | #328 | Tragic 77.9% |
| Immigrants | Dominica | 0.0 /100 | #329 | Tragic 77.8% |
| Immigrants | Trinidad and Tobago | 0.0 /100 | #330 | Tragic 76.8% |
| West Indians | 0.0 /100 | #331 | Tragic 76.4% |
| Trinidadians and Tobagonians | 0.0 /100 | #332 | Tragic 76.3% |
| Immigrants | Ecuador | 0.0 /100 | #333 | Tragic 76.2% |
| Immigrants | Bangladesh | 0.0 /100 | #334 | Tragic 74.3% |
| Barbadians | 0.0 /100 | #335 | Tragic 74.0% |
| Vietnamese | 0.0 /100 | #336 | Tragic 73.8% |
| Immigrants | Uzbekistan | 0.0 /100 | #337 | Tragic 73.4% |
| Inupiat | 0.0 /100 | #338 | Tragic 71.5% |
| Guyanese | 0.0 /100 | #339 | Tragic 70.8% |