Kenyan vs Irish 1 or more Vehicles in Household
COMPARE
Kenyan
Irish
1 or more Vehicles in Household
1 or more Vehicles in Household Comparison
Kenyans
Irish
90.4%
1 OR MORE VEHICLES IN HOUSEHOLD
87.0/ 100
METRIC RATING
134th/ 347
METRIC RANK
93.1%
1 OR MORE VEHICLES IN HOUSEHOLD
100.0/ 100
METRIC RATING
14th/ 347
METRIC RANK
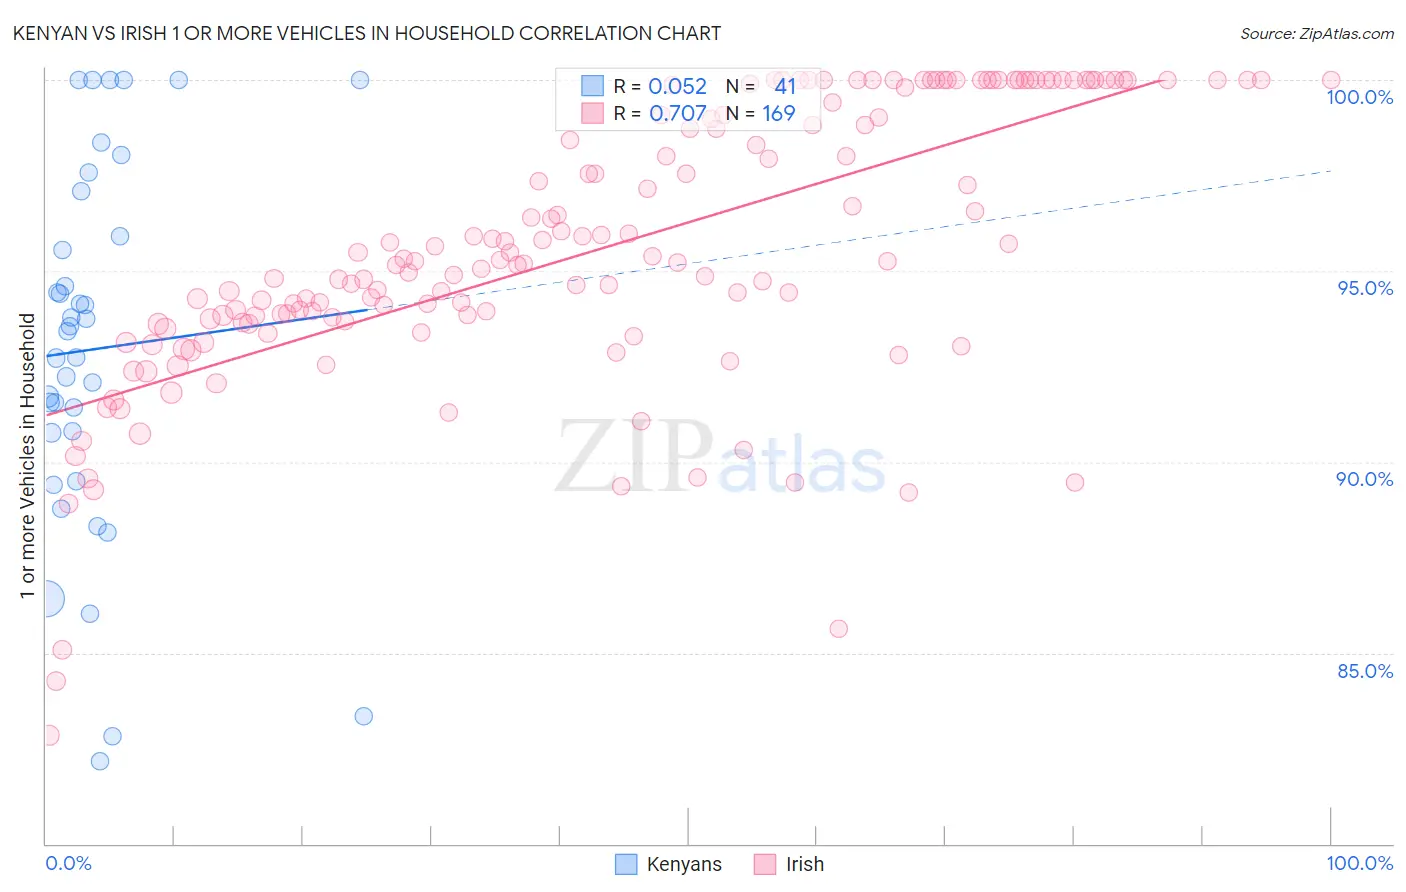
Kenyan vs Irish 1 or more Vehicles in Household Correlation Chart
The statistical analysis conducted on geographies consisting of 168,180,305 people shows a slight positive correlation between the proportion of Kenyans and percentage of households with 1 or more vehicles available in the United States with a correlation coefficient (R) of 0.052 and weighted average of 90.4%. Similarly, the statistical analysis conducted on geographies consisting of 554,668,080 people shows a strong positive correlation between the proportion of Irish and percentage of households with 1 or more vehicles available in the United States with a correlation coefficient (R) of 0.707 and weighted average of 93.1%, a difference of 3.0%.
1 or more Vehicles in Household Correlation Summary
| Measurement | Kenyan | Irish |
| Minimum | 82.2% | 82.8% |
| Maximum | 100.0% | 100.0% |
| Range | 17.8% | 17.2% |
| Mean | 93.0% | 95.6% |
| Median | 93.4% | 95.2% |
| Interquartile 25% (IQ1) | 90.1% | 93.6% |
| Interquartile 75% (IQ3) | 96.5% | 99.6% |
| Interquartile Range (IQR) | 6.4% | 6.0% |
| Standard Deviation (Sample) | 4.8% | 3.6% |
| Standard Deviation (Population) | 4.8% | 3.6% |
Similar Demographics by 1 or more Vehicles in Household
Demographics Similar to Kenyans by 1 or more Vehicles in Household
In terms of 1 or more vehicles in household, the demographic groups most similar to Kenyans are Immigrants from Oceania (90.4%, a difference of 0.0%), Immigrants from Syria (90.4%, a difference of 0.020%), Hungarian (90.3%, a difference of 0.020%), Latvian (90.3%, a difference of 0.020%), and Syrian (90.3%, a difference of 0.020%).
| Demographics | Rating | Rank | 1 or more Vehicles in Household |
| Immigrants | Azores | 89.1 /100 | #127 | Excellent 90.4% |
| Burmese | 89.0 /100 | #128 | Excellent 90.4% |
| Marshallese | 88.9 /100 | #129 | Excellent 90.4% |
| Nicaraguans | 88.8 /100 | #130 | Excellent 90.4% |
| Immigrants | Kenya | 88.5 /100 | #131 | Excellent 90.4% |
| Immigrants | South Africa | 88.1 /100 | #132 | Excellent 90.4% |
| Immigrants | Syria | 87.5 /100 | #133 | Excellent 90.4% |
| Kenyans | 87.0 /100 | #134 | Excellent 90.4% |
| Immigrants | Oceania | 86.9 /100 | #135 | Excellent 90.4% |
| Hungarians | 86.5 /100 | #136 | Excellent 90.3% |
| Latvians | 86.3 /100 | #137 | Excellent 90.3% |
| Syrians | 86.3 /100 | #138 | Excellent 90.3% |
| Estonians | 85.6 /100 | #139 | Excellent 90.3% |
| Sudanese | 85.2 /100 | #140 | Excellent 90.3% |
| Immigrants | Moldova | 83.1 /100 | #141 | Excellent 90.2% |
Demographics Similar to Irish by 1 or more Vehicles in Household
In terms of 1 or more vehicles in household, the demographic groups most similar to Irish are Mexican (93.0%, a difference of 0.020%), Assyrian/Chaldean/Syriac (93.0%, a difference of 0.020%), White/Caucasian (93.1%, a difference of 0.040%), European (93.0%, a difference of 0.040%), and Scandinavian (93.1%, a difference of 0.060%).
| Demographics | Rating | Rank | 1 or more Vehicles in Household |
| Scottish | 100.0 /100 | #7 | Exceptional 93.4% |
| Swedes | 100.0 /100 | #8 | Exceptional 93.3% |
| Scotch-Irish | 100.0 /100 | #9 | Exceptional 93.3% |
| Dutch | 100.0 /100 | #10 | Exceptional 93.3% |
| Czechs | 100.0 /100 | #11 | Exceptional 93.3% |
| Scandinavians | 100.0 /100 | #12 | Exceptional 93.1% |
| Whites/Caucasians | 100.0 /100 | #13 | Exceptional 93.1% |
| Irish | 100.0 /100 | #14 | Exceptional 93.1% |
| Mexicans | 100.0 /100 | #15 | Exceptional 93.0% |
| Assyrians/Chaldeans/Syriacs | 100.0 /100 | #16 | Exceptional 93.0% |
| Europeans | 100.0 /100 | #17 | Exceptional 93.0% |
| Welsh | 100.0 /100 | #18 | Exceptional 93.0% |
| Tongans | 100.0 /100 | #19 | Exceptional 92.9% |
| Arapaho | 100.0 /100 | #20 | Exceptional 92.7% |
| Ottawa | 100.0 /100 | #21 | Exceptional 92.7% |