Japanese vs Immigrants from Indonesia No Vehicles in Household
COMPARE
Japanese
Immigrants from Indonesia
No Vehicles in Household
No Vehicles in Household Comparison
Japanese
Immigrants from Indonesia
9.4%
NO VEHICLES IN HOUSEHOLD
94.1/ 100
METRIC RATING
116th/ 347
METRIC RANK
10.1%
NO VEHICLES IN HOUSEHOLD
69.3/ 100
METRIC RATING
159th/ 347
METRIC RANK
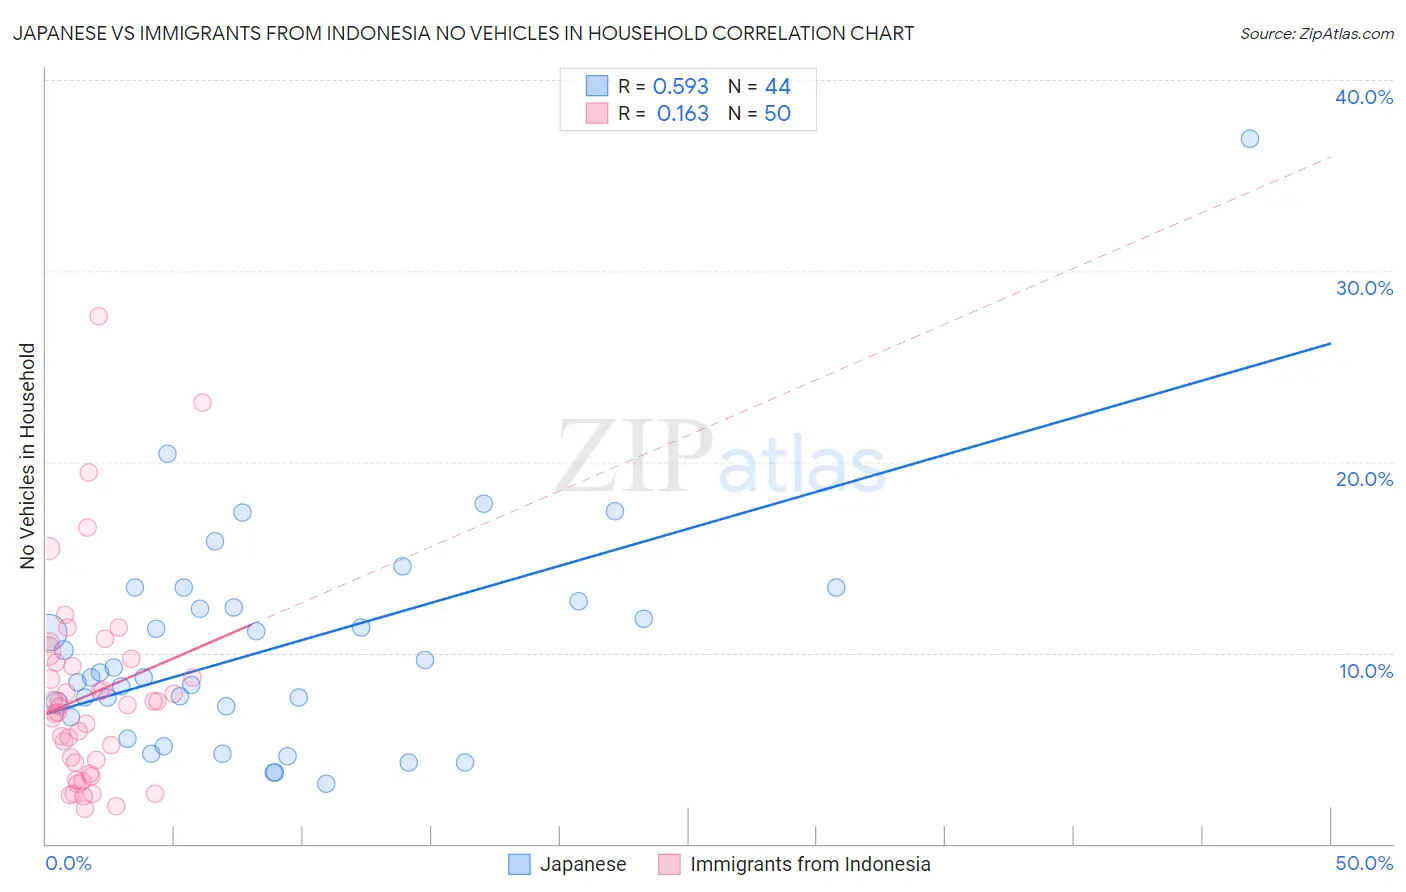
Japanese vs Immigrants from Indonesia No Vehicles in Household Correlation Chart
The statistical analysis conducted on geographies consisting of 248,891,204 people shows a substantial positive correlation between the proportion of Japanese and percentage of households with no vehicle available in the United States with a correlation coefficient (R) of 0.593 and weighted average of 9.4%. Similarly, the statistical analysis conducted on geographies consisting of 215,406,019 people shows a poor positive correlation between the proportion of Immigrants from Indonesia and percentage of households with no vehicle available in the United States with a correlation coefficient (R) of 0.163 and weighted average of 10.1%, a difference of 7.3%.
No Vehicles in Household Correlation Summary
| Measurement | Japanese | Immigrants from Indonesia |
| Minimum | 3.2% | 1.9% |
| Maximum | 36.9% | 27.7% |
| Range | 33.7% | 25.8% |
| Mean | 10.2% | 7.8% |
| Median | 8.9% | 7.2% |
| Interquartile 25% (IQ1) | 6.9% | 4.3% |
| Interquartile 75% (IQ3) | 12.6% | 9.5% |
| Interquartile Range (IQR) | 5.6% | 5.2% |
| Standard Deviation (Sample) | 5.9% | 5.2% |
| Standard Deviation (Population) | 5.8% | 5.2% |
Similar Demographics by No Vehicles in Household
Demographics Similar to Japanese by No Vehicles in Household
In terms of no vehicles in household, the demographic groups most similar to Japanese are Navajo (9.4%, a difference of 0.070%), Serbian (9.4%, a difference of 0.13%), Chippewa (9.4%, a difference of 0.17%), Immigrants from Netherlands (9.4%, a difference of 0.56%), and Armenian (9.4%, a difference of 0.66%).
| Demographics | Rating | Rank | No Vehicles in Household |
| Maltese | 97.6 /100 | #109 | Exceptional 9.1% |
| Delaware | 97.2 /100 | #110 | Exceptional 9.2% |
| Immigrants | Kuwait | 95.1 /100 | #111 | Exceptional 9.4% |
| Armenians | 95.0 /100 | #112 | Exceptional 9.4% |
| Immigrants | Netherlands | 94.8 /100 | #113 | Exceptional 9.4% |
| Serbians | 94.3 /100 | #114 | Exceptional 9.4% |
| Navajo | 94.2 /100 | #115 | Exceptional 9.4% |
| Japanese | 94.1 /100 | #116 | Exceptional 9.4% |
| Chippewa | 93.8 /100 | #117 | Exceptional 9.4% |
| Greeks | 92.9 /100 | #118 | Exceptional 9.5% |
| Fijians | 92.7 /100 | #119 | Exceptional 9.5% |
| Immigrants | Thailand | 92.6 /100 | #120 | Exceptional 9.5% |
| Puget Sound Salish | 92.4 /100 | #121 | Exceptional 9.5% |
| Costa Ricans | 92.3 /100 | #122 | Exceptional 9.5% |
| Blackfeet | 91.4 /100 | #123 | Exceptional 9.6% |
Demographics Similar to Immigrants from Indonesia by No Vehicles in Household
In terms of no vehicles in household, the demographic groups most similar to Immigrants from Indonesia are Spanish American Indian (10.1%, a difference of 0.15%), Australian (10.1%, a difference of 0.21%), Immigrants from Micronesia (10.1%, a difference of 0.26%), Salvadoran (10.1%, a difference of 0.51%), and Sioux (10.1%, a difference of 0.52%).
| Demographics | Rating | Rank | No Vehicles in Household |
| Immigrants | Congo | 73.0 /100 | #152 | Good 10.1% |
| Tlingit-Haida | 72.5 /100 | #153 | Good 10.1% |
| Sioux | 72.4 /100 | #154 | Good 10.1% |
| Salvadorans | 72.4 /100 | #155 | Good 10.1% |
| Immigrants | Micronesia | 70.9 /100 | #156 | Good 10.1% |
| Australians | 70.6 /100 | #157 | Good 10.1% |
| Spanish American Indians | 70.2 /100 | #158 | Good 10.1% |
| Immigrants | Indonesia | 69.3 /100 | #159 | Good 10.1% |
| Immigrants | Middle Africa | 65.7 /100 | #160 | Good 10.2% |
| New Zealanders | 65.1 /100 | #161 | Good 10.2% |
| Immigrants | Austria | 64.4 /100 | #162 | Good 10.2% |
| Immigrants | Cambodia | 63.7 /100 | #163 | Good 10.2% |
| South Africans | 61.1 /100 | #164 | Good 10.2% |
| Comanche | 60.8 /100 | #165 | Good 10.2% |
| Immigrants | Costa Rica | 60.5 /100 | #166 | Good 10.3% |