Czechoslovakian vs Immigrants from Indonesia No Vehicles in Household
COMPARE
Czechoslovakian
Immigrants from Indonesia
No Vehicles in Household
No Vehicles in Household Comparison
Czechoslovakians
Immigrants from Indonesia
7.8%
NO VEHICLES IN HOUSEHOLD
99.9/ 100
METRIC RATING
40th/ 347
METRIC RANK
10.1%
NO VEHICLES IN HOUSEHOLD
69.3/ 100
METRIC RATING
159th/ 347
METRIC RANK
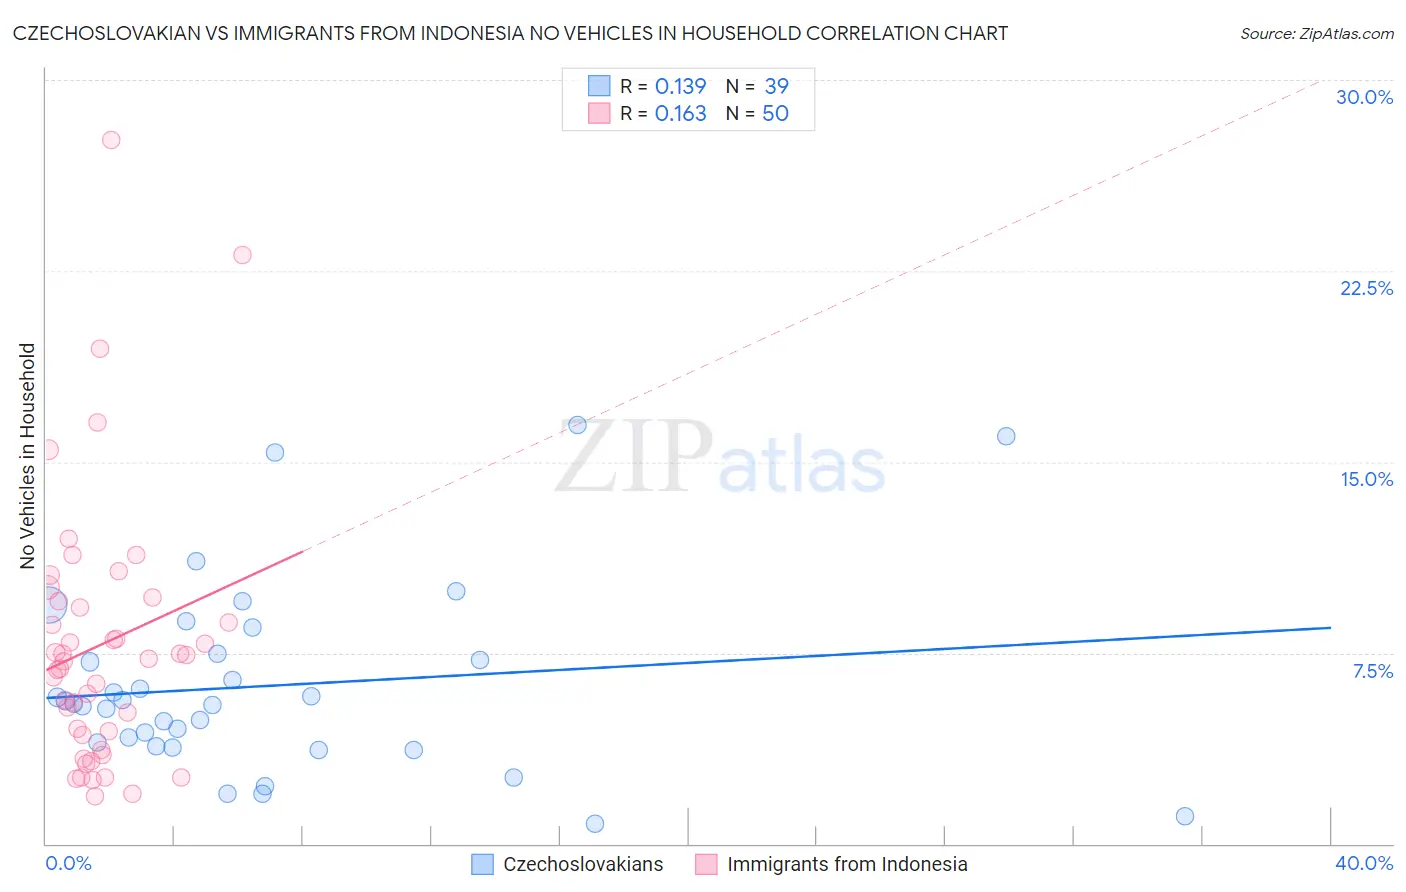
Czechoslovakian vs Immigrants from Indonesia No Vehicles in Household Correlation Chart
The statistical analysis conducted on geographies consisting of 367,718,828 people shows a poor positive correlation between the proportion of Czechoslovakians and percentage of households with no vehicle available in the United States with a correlation coefficient (R) of 0.139 and weighted average of 7.8%. Similarly, the statistical analysis conducted on geographies consisting of 215,406,019 people shows a poor positive correlation between the proportion of Immigrants from Indonesia and percentage of households with no vehicle available in the United States with a correlation coefficient (R) of 0.163 and weighted average of 10.1%, a difference of 29.2%.
No Vehicles in Household Correlation Summary
| Measurement | Czechoslovakian | Immigrants from Indonesia |
| Minimum | 0.79% | 1.9% |
| Maximum | 16.4% | 27.7% |
| Range | 15.7% | 25.8% |
| Mean | 6.2% | 7.8% |
| Median | 5.5% | 7.2% |
| Interquartile 25% (IQ1) | 3.8% | 4.3% |
| Interquartile 75% (IQ3) | 7.5% | 9.5% |
| Interquartile Range (IQR) | 3.6% | 5.2% |
| Standard Deviation (Sample) | 3.7% | 5.2% |
| Standard Deviation (Population) | 3.7% | 5.2% |
Similar Demographics by No Vehicles in Household
Demographics Similar to Czechoslovakians by No Vehicles in Household
In terms of no vehicles in household, the demographic groups most similar to Czechoslovakians are Immigrants from Fiji (7.8%, a difference of 0.10%), French Canadian (7.8%, a difference of 0.14%), Swiss (7.9%, a difference of 0.28%), Chickasaw (7.9%, a difference of 0.36%), and Creek (7.8%, a difference of 0.68%).
| Demographics | Rating | Rank | No Vehicles in Household |
| Immigrants | Taiwan | 100.0 /100 | #33 | Exceptional 7.7% |
| Immigrants | Vietnam | 100.0 /100 | #34 | Exceptional 7.7% |
| Cherokee | 99.9 /100 | #35 | Exceptional 7.7% |
| Iraqis | 99.9 /100 | #36 | Exceptional 7.7% |
| Basques | 99.9 /100 | #37 | Exceptional 7.8% |
| Creek | 99.9 /100 | #38 | Exceptional 7.8% |
| Immigrants | Fiji | 99.9 /100 | #39 | Exceptional 7.8% |
| Czechoslovakians | 99.9 /100 | #40 | Exceptional 7.8% |
| French Canadians | 99.9 /100 | #41 | Exceptional 7.8% |
| Swiss | 99.9 /100 | #42 | Exceptional 7.9% |
| Chickasaw | 99.9 /100 | #43 | Exceptional 7.9% |
| Choctaw | 99.9 /100 | #44 | Exceptional 7.9% |
| Immigrants | Nonimmigrants | 99.9 /100 | #45 | Exceptional 7.9% |
| Spanish | 99.9 /100 | #46 | Exceptional 7.9% |
| Northern Europeans | 99.9 /100 | #47 | Exceptional 7.9% |
Demographics Similar to Immigrants from Indonesia by No Vehicles in Household
In terms of no vehicles in household, the demographic groups most similar to Immigrants from Indonesia are Spanish American Indian (10.1%, a difference of 0.15%), Australian (10.1%, a difference of 0.21%), Immigrants from Micronesia (10.1%, a difference of 0.26%), Salvadoran (10.1%, a difference of 0.51%), and Sioux (10.1%, a difference of 0.52%).
| Demographics | Rating | Rank | No Vehicles in Household |
| Immigrants | Congo | 73.0 /100 | #152 | Good 10.1% |
| Tlingit-Haida | 72.5 /100 | #153 | Good 10.1% |
| Sioux | 72.4 /100 | #154 | Good 10.1% |
| Salvadorans | 72.4 /100 | #155 | Good 10.1% |
| Immigrants | Micronesia | 70.9 /100 | #156 | Good 10.1% |
| Australians | 70.6 /100 | #157 | Good 10.1% |
| Spanish American Indians | 70.2 /100 | #158 | Good 10.1% |
| Immigrants | Indonesia | 69.3 /100 | #159 | Good 10.1% |
| Immigrants | Middle Africa | 65.7 /100 | #160 | Good 10.2% |
| New Zealanders | 65.1 /100 | #161 | Good 10.2% |
| Immigrants | Austria | 64.4 /100 | #162 | Good 10.2% |
| Immigrants | Cambodia | 63.7 /100 | #163 | Good 10.2% |
| South Africans | 61.1 /100 | #164 | Good 10.2% |
| Comanche | 60.8 /100 | #165 | Good 10.2% |
| Immigrants | Costa Rica | 60.5 /100 | #166 | Good 10.3% |