Immigrants from Afghanistan vs Immigrants from Indonesia No Vehicles in Household
COMPARE
Immigrants from Afghanistan
Immigrants from Indonesia
No Vehicles in Household
No Vehicles in Household Comparison
Immigrants from Afghanistan
Immigrants from Indonesia
8.1%
NO VEHICLES IN HOUSEHOLD
99.9/ 100
METRIC RATING
56th/ 347
METRIC RANK
10.1%
NO VEHICLES IN HOUSEHOLD
69.3/ 100
METRIC RATING
159th/ 347
METRIC RANK
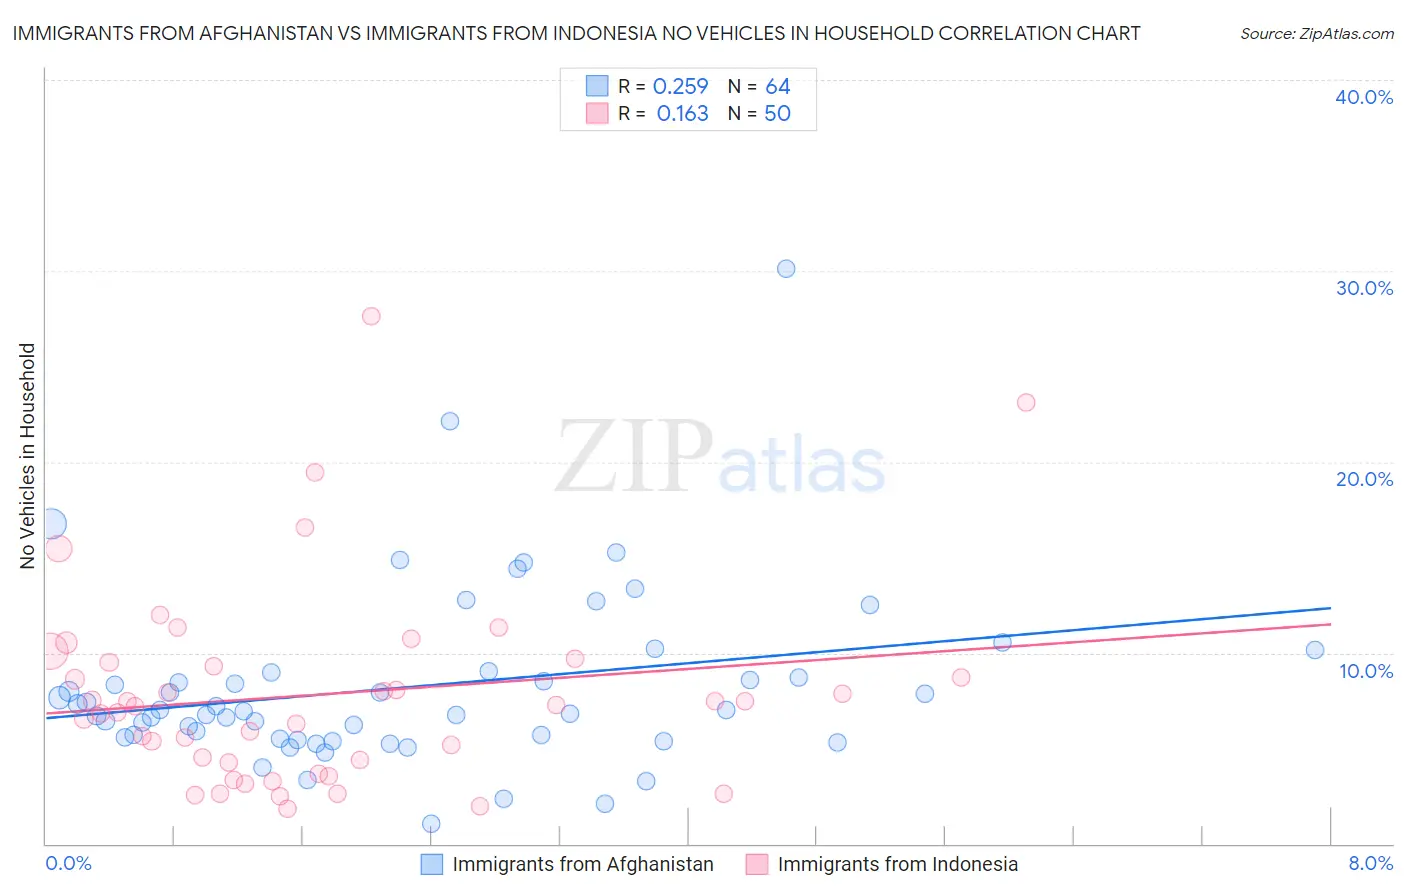
Immigrants from Afghanistan vs Immigrants from Indonesia No Vehicles in Household Correlation Chart
The statistical analysis conducted on geographies consisting of 147,593,124 people shows a weak positive correlation between the proportion of Immigrants from Afghanistan and percentage of households with no vehicle available in the United States with a correlation coefficient (R) of 0.259 and weighted average of 8.1%. Similarly, the statistical analysis conducted on geographies consisting of 215,406,019 people shows a poor positive correlation between the proportion of Immigrants from Indonesia and percentage of households with no vehicle available in the United States with a correlation coefficient (R) of 0.163 and weighted average of 10.1%, a difference of 24.8%.
No Vehicles in Household Correlation Summary
| Measurement | Immigrants from Afghanistan | Immigrants from Indonesia |
| Minimum | 1.1% | 1.9% |
| Maximum | 30.1% | 27.7% |
| Range | 29.0% | 25.8% |
| Mean | 8.2% | 7.8% |
| Median | 7.0% | 7.2% |
| Interquartile 25% (IQ1) | 5.6% | 4.3% |
| Interquartile 75% (IQ3) | 8.8% | 9.5% |
| Interquartile Range (IQR) | 3.3% | 5.2% |
| Standard Deviation (Sample) | 4.7% | 5.2% |
| Standard Deviation (Population) | 4.6% | 5.2% |
Similar Demographics by No Vehicles in Household
Demographics Similar to Immigrants from Afghanistan by No Vehicles in Household
In terms of no vehicles in household, the demographic groups most similar to Immigrants from Afghanistan are Venezuelan (8.1%, a difference of 0.28%), Celtic (8.1%, a difference of 0.39%), Immigrants from Mexico (8.1%, a difference of 0.39%), Immigrants from Venezuela (8.1%, a difference of 0.48%), and Immigrants from India (8.2%, a difference of 0.74%).
| Demographics | Rating | Rank | No Vehicles in Household |
| Guamanians/Chamorros | 99.9 /100 | #49 | Exceptional 8.0% |
| Belgians | 99.9 /100 | #50 | Exceptional 8.0% |
| Koreans | 99.9 /100 | #51 | Exceptional 8.0% |
| Hawaiians | 99.9 /100 | #52 | Exceptional 8.0% |
| Slovenes | 99.9 /100 | #53 | Exceptional 8.0% |
| Immigrants | Venezuela | 99.9 /100 | #54 | Exceptional 8.1% |
| Celtics | 99.9 /100 | #55 | Exceptional 8.1% |
| Immigrants | Afghanistan | 99.9 /100 | #56 | Exceptional 8.1% |
| Venezuelans | 99.8 /100 | #57 | Exceptional 8.1% |
| Immigrants | Mexico | 99.8 /100 | #58 | Exceptional 8.1% |
| Immigrants | India | 99.8 /100 | #59 | Exceptional 8.2% |
| Immigrants | Laos | 99.8 /100 | #60 | Exceptional 8.2% |
| Thais | 99.8 /100 | #61 | Exceptional 8.2% |
| Chinese | 99.8 /100 | #62 | Exceptional 8.2% |
| Slovaks | 99.8 /100 | #63 | Exceptional 8.3% |
Demographics Similar to Immigrants from Indonesia by No Vehicles in Household
In terms of no vehicles in household, the demographic groups most similar to Immigrants from Indonesia are Spanish American Indian (10.1%, a difference of 0.15%), Australian (10.1%, a difference of 0.21%), Immigrants from Micronesia (10.1%, a difference of 0.26%), Salvadoran (10.1%, a difference of 0.51%), and Sioux (10.1%, a difference of 0.52%).
| Demographics | Rating | Rank | No Vehicles in Household |
| Immigrants | Congo | 73.0 /100 | #152 | Good 10.1% |
| Tlingit-Haida | 72.5 /100 | #153 | Good 10.1% |
| Sioux | 72.4 /100 | #154 | Good 10.1% |
| Salvadorans | 72.4 /100 | #155 | Good 10.1% |
| Immigrants | Micronesia | 70.9 /100 | #156 | Good 10.1% |
| Australians | 70.6 /100 | #157 | Good 10.1% |
| Spanish American Indians | 70.2 /100 | #158 | Good 10.1% |
| Immigrants | Indonesia | 69.3 /100 | #159 | Good 10.1% |
| Immigrants | Middle Africa | 65.7 /100 | #160 | Good 10.2% |
| New Zealanders | 65.1 /100 | #161 | Good 10.2% |
| Immigrants | Austria | 64.4 /100 | #162 | Good 10.2% |
| Immigrants | Cambodia | 63.7 /100 | #163 | Good 10.2% |
| South Africans | 61.1 /100 | #164 | Good 10.2% |
| Comanche | 60.8 /100 | #165 | Good 10.2% |
| Immigrants | Costa Rica | 60.5 /100 | #166 | Good 10.3% |