Sioux vs Immigrants from Indonesia No Vehicles in Household
COMPARE
Sioux
Immigrants from Indonesia
No Vehicles in Household
No Vehicles in Household Comparison
Sioux
Immigrants from Indonesia
10.1%
NO VEHICLES IN HOUSEHOLD
72.4/ 100
METRIC RATING
154th/ 347
METRIC RANK
10.1%
NO VEHICLES IN HOUSEHOLD
69.3/ 100
METRIC RATING
159th/ 347
METRIC RANK
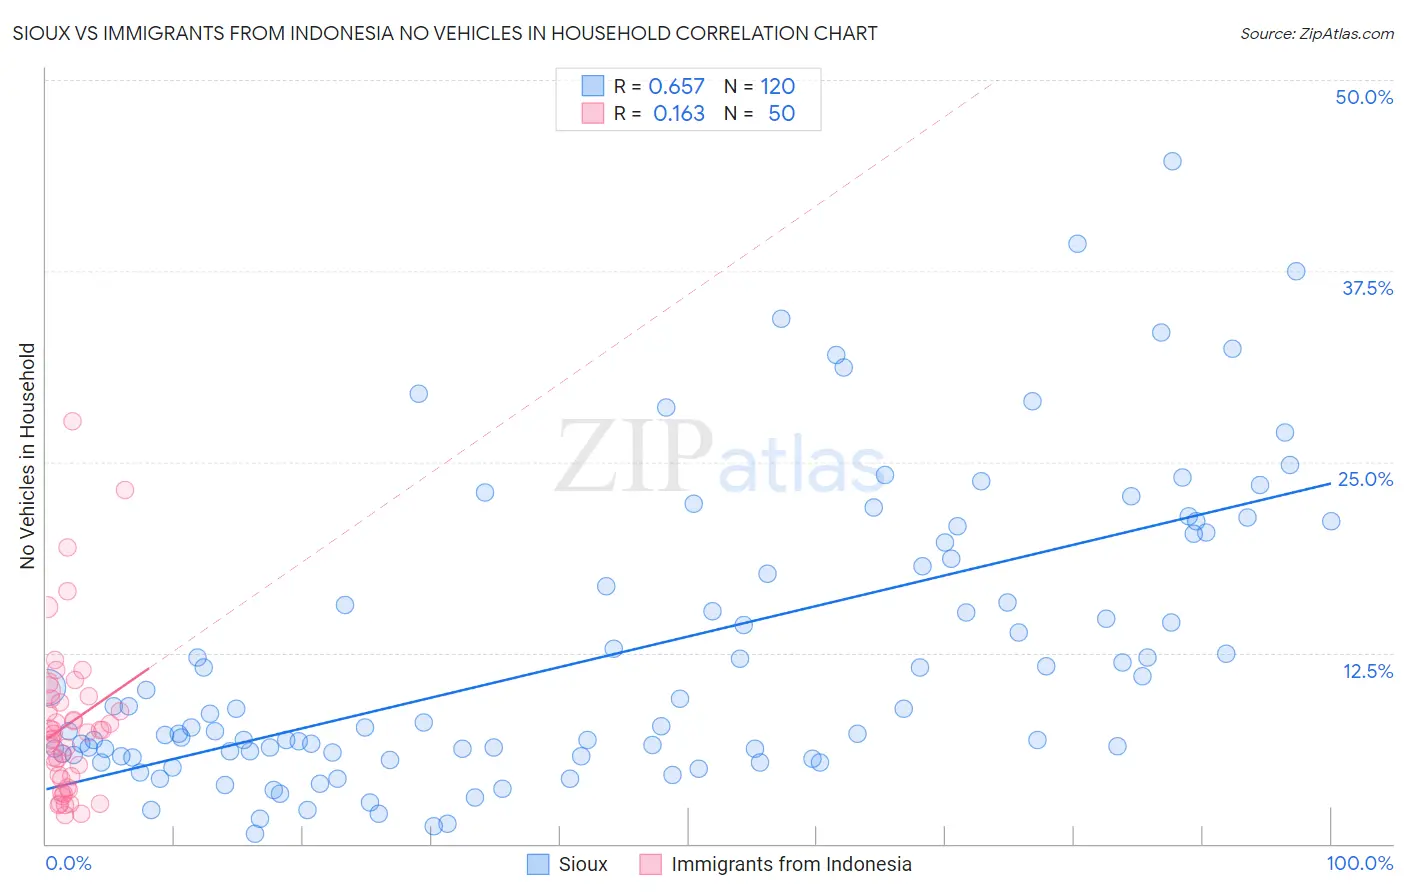
Sioux vs Immigrants from Indonesia No Vehicles in Household Correlation Chart
The statistical analysis conducted on geographies consisting of 233,693,165 people shows a significant positive correlation between the proportion of Sioux and percentage of households with no vehicle available in the United States with a correlation coefficient (R) of 0.657 and weighted average of 10.1%. Similarly, the statistical analysis conducted on geographies consisting of 215,406,019 people shows a poor positive correlation between the proportion of Immigrants from Indonesia and percentage of households with no vehicle available in the United States with a correlation coefficient (R) of 0.163 and weighted average of 10.1%, a difference of 0.52%.
No Vehicles in Household Correlation Summary
| Measurement | Sioux | Immigrants from Indonesia |
| Minimum | 0.66% | 1.9% |
| Maximum | 44.7% | 27.7% |
| Range | 44.0% | 25.8% |
| Mean | 12.4% | 7.8% |
| Median | 7.8% | 7.2% |
| Interquartile 25% (IQ1) | 5.8% | 4.3% |
| Interquartile 75% (IQ3) | 18.4% | 9.5% |
| Interquartile Range (IQR) | 12.5% | 5.2% |
| Standard Deviation (Sample) | 9.5% | 5.2% |
| Standard Deviation (Population) | 9.4% | 5.2% |
Demographics Similar to Sioux and Immigrants from Indonesia by No Vehicles in Household
In terms of no vehicles in household, the demographic groups most similar to Sioux are Salvadoran (10.1%, a difference of 0.010%), Tlingit-Haida (10.1%, a difference of 0.020%), Immigrants from Congo (10.1%, a difference of 0.11%), Immigrants from Eastern Africa (10.0%, a difference of 0.25%), and Colombian (10.0%, a difference of 0.26%). Similarly, the demographic groups most similar to Immigrants from Indonesia are Spanish American Indian (10.1%, a difference of 0.15%), Australian (10.1%, a difference of 0.21%), Immigrants from Micronesia (10.1%, a difference of 0.26%), Salvadoran (10.1%, a difference of 0.51%), and Tlingit-Haida (10.1%, a difference of 0.54%).
| Demographics | Rating | Rank | No Vehicles in Household |
| Hungarians | 80.0 /100 | #146 | Excellent 9.9% |
| Immigrants | Nicaragua | 79.8 /100 | #147 | Good 9.9% |
| Immigrants | Bosnia and Herzegovina | 79.1 /100 | #148 | Good 9.9% |
| Immigrants | Uganda | 76.1 /100 | #149 | Good 10.0% |
| Colombians | 73.9 /100 | #150 | Good 10.0% |
| Immigrants | Eastern Africa | 73.8 /100 | #151 | Good 10.0% |
| Immigrants | Congo | 73.0 /100 | #152 | Good 10.1% |
| Tlingit-Haida | 72.5 /100 | #153 | Good 10.1% |
| Sioux | 72.4 /100 | #154 | Good 10.1% |
| Salvadorans | 72.4 /100 | #155 | Good 10.1% |
| Immigrants | Micronesia | 70.9 /100 | #156 | Good 10.1% |
| Australians | 70.6 /100 | #157 | Good 10.1% |
| Spanish American Indians | 70.2 /100 | #158 | Good 10.1% |
| Immigrants | Indonesia | 69.3 /100 | #159 | Good 10.1% |
| Immigrants | Middle Africa | 65.7 /100 | #160 | Good 10.2% |
| New Zealanders | 65.1 /100 | #161 | Good 10.2% |
| Immigrants | Austria | 64.4 /100 | #162 | Good 10.2% |
| Immigrants | Cambodia | 63.7 /100 | #163 | Good 10.2% |
| South Africans | 61.1 /100 | #164 | Good 10.2% |
| Comanche | 60.8 /100 | #165 | Good 10.2% |
| Immigrants | Costa Rica | 60.5 /100 | #166 | Good 10.3% |