Japanese vs Immigrants from Indonesia Unemployment
COMPARE
Japanese
Immigrants from Indonesia
Unemployment
Unemployment Comparison
Japanese
Immigrants from Indonesia
5.6%
UNEMPLOYMENT
0.8/ 100
METRIC RATING
250th/ 347
METRIC RANK
5.2%
UNEMPLOYMENT
61.2/ 100
METRIC RATING
166th/ 347
METRIC RANK
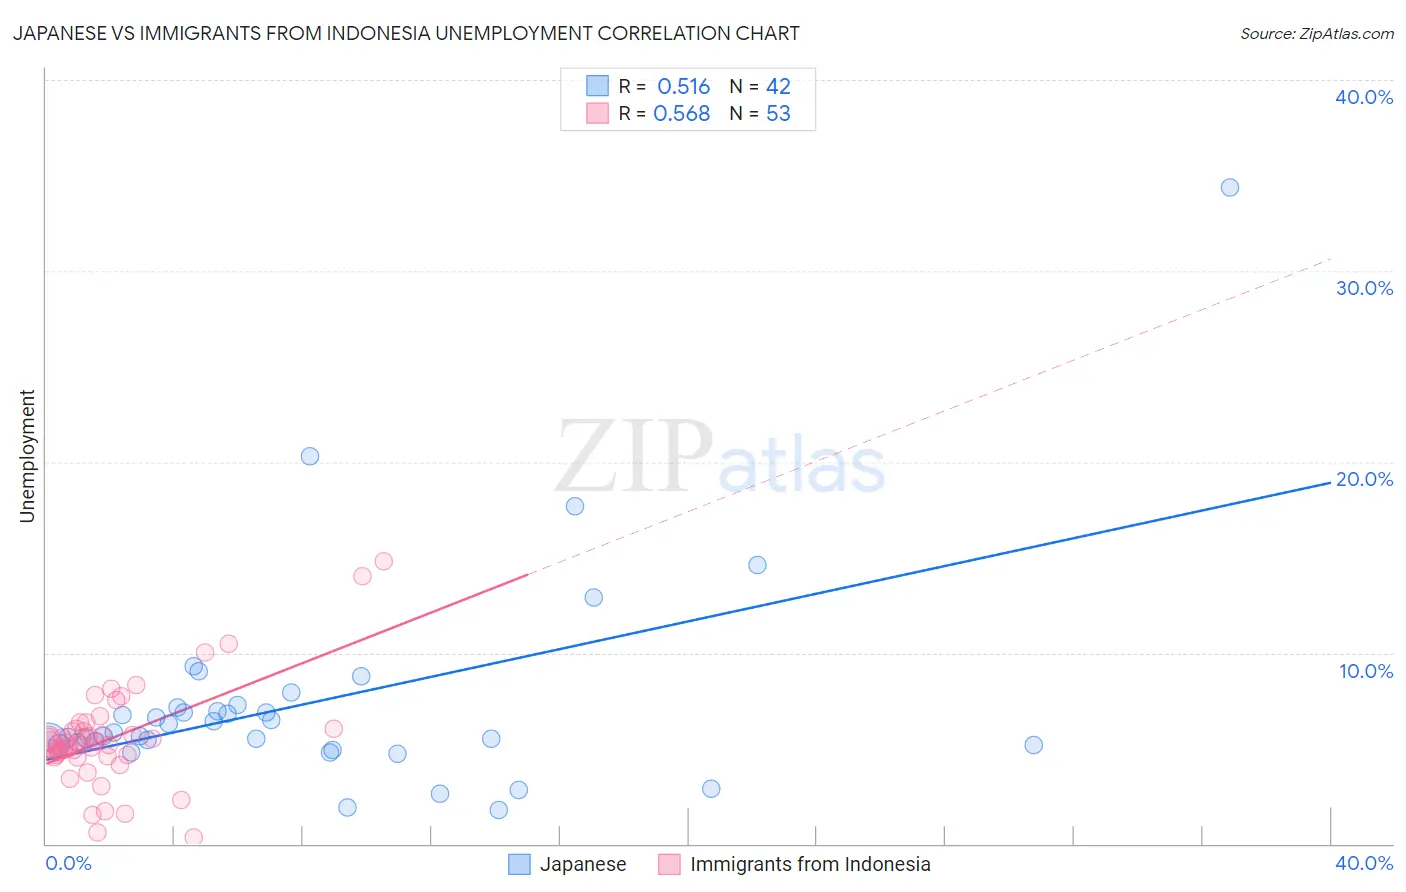
Japanese vs Immigrants from Indonesia Unemployment Correlation Chart
The statistical analysis conducted on geographies consisting of 249,076,576 people shows a substantial positive correlation between the proportion of Japanese and unemployment in the United States with a correlation coefficient (R) of 0.516 and weighted average of 5.6%. Similarly, the statistical analysis conducted on geographies consisting of 215,714,368 people shows a substantial positive correlation between the proportion of Immigrants from Indonesia and unemployment in the United States with a correlation coefficient (R) of 0.568 and weighted average of 5.2%, a difference of 8.2%.
Unemployment Correlation Summary
| Measurement | Japanese | Immigrants from Indonesia |
| Minimum | 1.8% | 0.30% |
| Maximum | 34.4% | 14.8% |
| Range | 32.6% | 14.5% |
| Mean | 7.4% | 5.5% |
| Median | 5.8% | 5.3% |
| Interquartile 25% (IQ1) | 5.2% | 4.6% |
| Interquartile 75% (IQ3) | 7.1% | 6.0% |
| Interquartile Range (IQR) | 1.9% | 1.4% |
| Standard Deviation (Sample) | 5.6% | 2.7% |
| Standard Deviation (Population) | 5.6% | 2.6% |
Similar Demographics by Unemployment
Demographics Similar to Japanese by Unemployment
In terms of unemployment, the demographic groups most similar to Japanese are Cajun (5.6%, a difference of 0.010%), Liberian (5.6%, a difference of 0.27%), Immigrants from Cameroon (5.6%, a difference of 0.40%), Kiowa (5.7%, a difference of 0.47%), and Bermudan (5.6%, a difference of 0.55%).
| Demographics | Rating | Rank | Unemployment |
| Marshallese | 1.3 /100 | #243 | Tragic 5.6% |
| Dutch West Indians | 1.2 /100 | #244 | Tragic 5.6% |
| French American Indians | 1.2 /100 | #245 | Tragic 5.6% |
| Bermudans | 1.1 /100 | #246 | Tragic 5.6% |
| Immigrants | Cameroon | 1.0 /100 | #247 | Tragic 5.6% |
| Liberians | 0.9 /100 | #248 | Tragic 5.6% |
| Cajuns | 0.8 /100 | #249 | Tragic 5.6% |
| Japanese | 0.8 /100 | #250 | Tragic 5.6% |
| Kiowa | 0.6 /100 | #251 | Tragic 5.7% |
| Hondurans | 0.3 /100 | #252 | Tragic 5.7% |
| Central Americans | 0.3 /100 | #253 | Tragic 5.7% |
| Immigrants | Honduras | 0.3 /100 | #254 | Tragic 5.7% |
| Immigrants | Portugal | 0.2 /100 | #255 | Tragic 5.7% |
| Guatemalans | 0.2 /100 | #256 | Tragic 5.8% |
| Yaqui | 0.2 /100 | #257 | Tragic 5.8% |
Demographics Similar to Immigrants from Indonesia by Unemployment
In terms of unemployment, the demographic groups most similar to Immigrants from Indonesia are Colombian (5.2%, a difference of 0.010%), Uruguayan (5.2%, a difference of 0.060%), Immigrants from Brazil (5.2%, a difference of 0.13%), Immigrants from Morocco (5.2%, a difference of 0.14%), and Immigrants from Zaire (5.2%, a difference of 0.23%).
| Demographics | Rating | Rank | Unemployment |
| Immigrants | Russia | 66.6 /100 | #159 | Good 5.2% |
| Laotians | 66.3 /100 | #160 | Good 5.2% |
| Immigrants | Oceania | 65.2 /100 | #161 | Good 5.2% |
| Spanish | 65.1 /100 | #162 | Good 5.2% |
| Immigrants | Zaire | 64.7 /100 | #163 | Good 5.2% |
| Immigrants | Colombia | 64.7 /100 | #164 | Good 5.2% |
| Immigrants | Brazil | 63.1 /100 | #165 | Good 5.2% |
| Immigrants | Indonesia | 61.2 /100 | #166 | Good 5.2% |
| Colombians | 61.1 /100 | #167 | Good 5.2% |
| Uruguayans | 60.2 /100 | #168 | Good 5.2% |
| Immigrants | Morocco | 59.1 /100 | #169 | Average 5.2% |
| Immigrants | Nicaragua | 57.1 /100 | #170 | Average 5.2% |
| Puget Sound Salish | 56.6 /100 | #171 | Average 5.2% |
| Immigrants | Vietnam | 52.5 /100 | #172 | Average 5.2% |
| Immigrants | Poland | 51.8 /100 | #173 | Average 5.3% |