Japanese vs Nigerian No Vehicles in Household
COMPARE
Japanese
Nigerian
No Vehicles in Household
No Vehicles in Household Comparison
Japanese
Nigerians
9.4%
NO VEHICLES IN HOUSEHOLD
94.1/ 100
METRIC RATING
116th/ 347
METRIC RANK
12.1%
NO VEHICLES IN HOUSEHOLD
0.9/ 100
METRIC RATING
257th/ 347
METRIC RANK
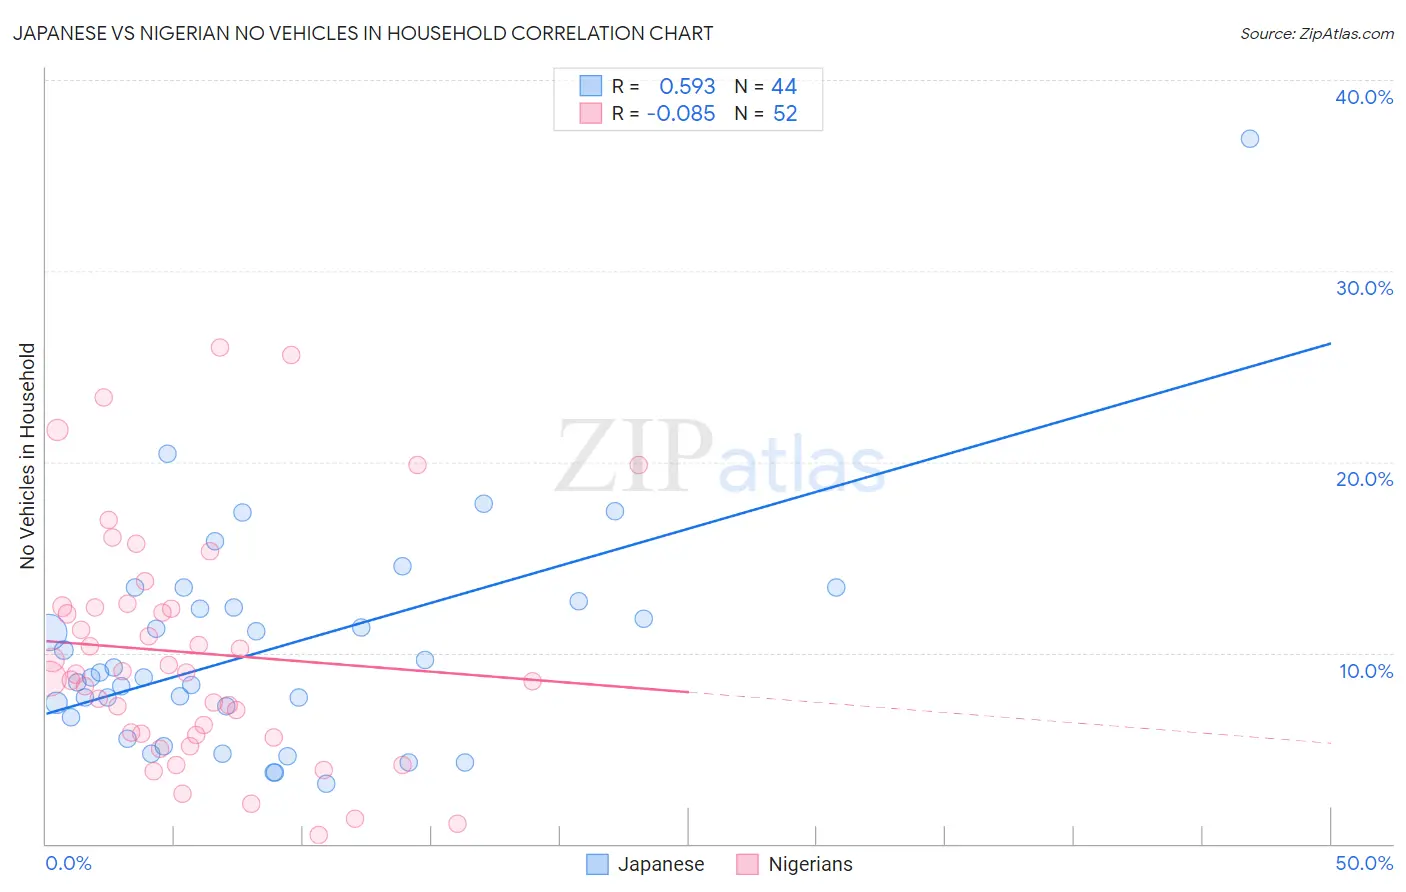
Japanese vs Nigerian No Vehicles in Household Correlation Chart
The statistical analysis conducted on geographies consisting of 248,891,204 people shows a substantial positive correlation between the proportion of Japanese and percentage of households with no vehicle available in the United States with a correlation coefficient (R) of 0.593 and weighted average of 9.4%. Similarly, the statistical analysis conducted on geographies consisting of 332,141,905 people shows a slight negative correlation between the proportion of Nigerians and percentage of households with no vehicle available in the United States with a correlation coefficient (R) of -0.085 and weighted average of 12.1%, a difference of 27.9%.
No Vehicles in Household Correlation Summary
| Measurement | Japanese | Nigerian |
| Minimum | 3.2% | 0.47% |
| Maximum | 36.9% | 26.0% |
| Range | 33.7% | 25.5% |
| Mean | 10.2% | 10.0% |
| Median | 8.9% | 8.9% |
| Interquartile 25% (IQ1) | 6.9% | 5.7% |
| Interquartile 75% (IQ3) | 12.6% | 12.4% |
| Interquartile Range (IQR) | 5.6% | 6.7% |
| Standard Deviation (Sample) | 5.9% | 6.1% |
| Standard Deviation (Population) | 5.8% | 6.0% |
Similar Demographics by No Vehicles in Household
Demographics Similar to Japanese by No Vehicles in Household
In terms of no vehicles in household, the demographic groups most similar to Japanese are Navajo (9.4%, a difference of 0.070%), Serbian (9.4%, a difference of 0.13%), Chippewa (9.4%, a difference of 0.17%), Immigrants from Netherlands (9.4%, a difference of 0.56%), and Armenian (9.4%, a difference of 0.66%).
| Demographics | Rating | Rank | No Vehicles in Household |
| Maltese | 97.6 /100 | #109 | Exceptional 9.1% |
| Delaware | 97.2 /100 | #110 | Exceptional 9.2% |
| Immigrants | Kuwait | 95.1 /100 | #111 | Exceptional 9.4% |
| Armenians | 95.0 /100 | #112 | Exceptional 9.4% |
| Immigrants | Netherlands | 94.8 /100 | #113 | Exceptional 9.4% |
| Serbians | 94.3 /100 | #114 | Exceptional 9.4% |
| Navajo | 94.2 /100 | #115 | Exceptional 9.4% |
| Japanese | 94.1 /100 | #116 | Exceptional 9.4% |
| Chippewa | 93.8 /100 | #117 | Exceptional 9.4% |
| Greeks | 92.9 /100 | #118 | Exceptional 9.5% |
| Fijians | 92.7 /100 | #119 | Exceptional 9.5% |
| Immigrants | Thailand | 92.6 /100 | #120 | Exceptional 9.5% |
| Puget Sound Salish | 92.4 /100 | #121 | Exceptional 9.5% |
| Costa Ricans | 92.3 /100 | #122 | Exceptional 9.5% |
| Blackfeet | 91.4 /100 | #123 | Exceptional 9.6% |
Demographics Similar to Nigerians by No Vehicles in Household
In terms of no vehicles in household, the demographic groups most similar to Nigerians are South American Indian (12.1%, a difference of 0.020%), Immigrants from Latvia (12.1%, a difference of 0.26%), Liberian (12.0%, a difference of 0.74%), Honduran (12.0%, a difference of 0.79%), and Macedonian (12.2%, a difference of 0.82%).
| Demographics | Rating | Rank | No Vehicles in Household |
| Paiute | 1.8 /100 | #250 | Tragic 11.8% |
| Blacks/African Americans | 1.6 /100 | #251 | Tragic 11.9% |
| Immigrants | Serbia | 1.5 /100 | #252 | Tragic 11.9% |
| Egyptians | 1.4 /100 | #253 | Tragic 11.9% |
| Immigrants | Uruguay | 1.3 /100 | #254 | Tragic 11.9% |
| Hondurans | 1.2 /100 | #255 | Tragic 12.0% |
| Liberians | 1.2 /100 | #256 | Tragic 12.0% |
| Nigerians | 0.9 /100 | #257 | Tragic 12.1% |
| South American Indians | 0.9 /100 | #258 | Tragic 12.1% |
| Immigrants | Latvia | 0.8 /100 | #259 | Tragic 12.1% |
| Macedonians | 0.7 /100 | #260 | Tragic 12.2% |
| Sub-Saharan Africans | 0.6 /100 | #261 | Tragic 12.2% |
| Immigrants | Liberia | 0.6 /100 | #262 | Tragic 12.2% |
| Immigrants | Egypt | 0.6 /100 | #263 | Tragic 12.2% |
| Immigrants | Switzerland | 0.5 /100 | #264 | Tragic 12.3% |